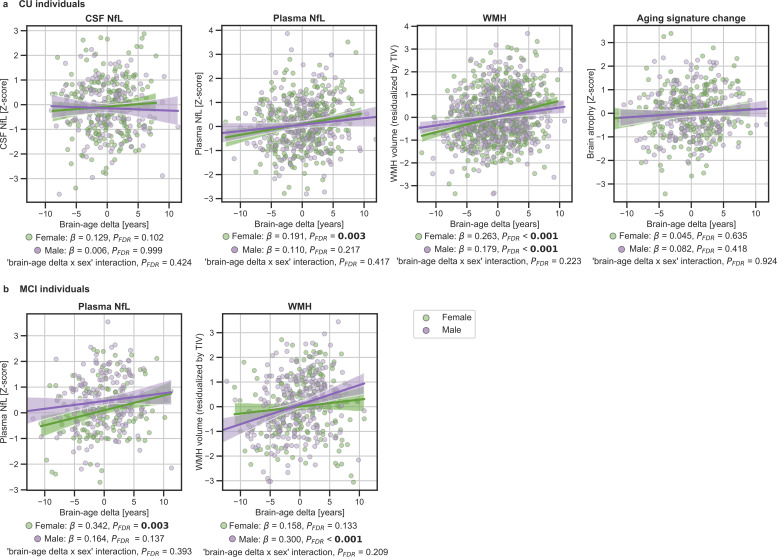
Figure 4. In (a) and (b), the associations of brain-age delta and continuous validation variables stratified by sex for (a) CU individuals and (b) MCI individuals.
Scatter plots representing the associations of CSF NfL, plasma NfL, brain atrophy and WMH with brain-age delta in females (green) and males (purple). Each point depicts the value of the validation biomarkers of an individual and the solid lines indicate the regression line for each of the groups. 95% Confidence intervals are shown in the shaded areas. The standardized regression coefficients (β) and the corrected p-values are shown, which were computed using a linear model adjusting for age and sex. Additionally, we also computed the ‘brain-age delta x sex’ interaction term. The sample size for each variable can be seen in Table 5.

