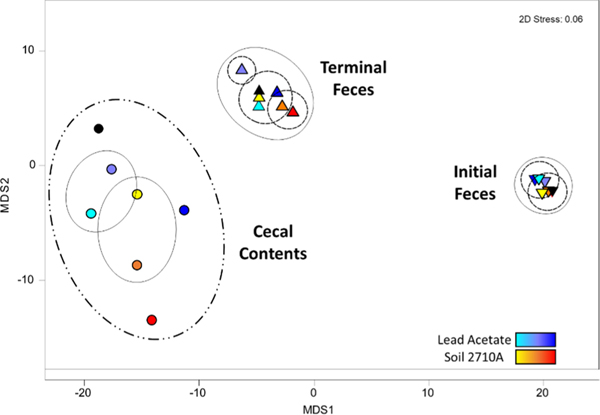
Fig. 1.
Relationship of OTUs among sample type, Pb amendment, and Pb dose in a metric multidimensional scaling plot. Lines enclose groups based on Bray-Curtis distances: dot-dash, 30; solid gray, 25; dotted 20. Analysis based on 5000 OTU sequences per sample. Circles represent cecal contents on day 9; inverted triangles, fecal contents on Day 2; and triangles, fecal contents on Day 9. Lead acetate dietary doses are represented by aqua, 6.25 mg/kg; purple, 12.5 mg/kg; and navy, 25 mg/kg; Pb SRM 2710a dietary doses are represented by yellow, 7.5 mg/kg; orange, 15 mg/kg; and red, 30 mg/kg. Black fill designates the control with 0 mg/kg Pb.

