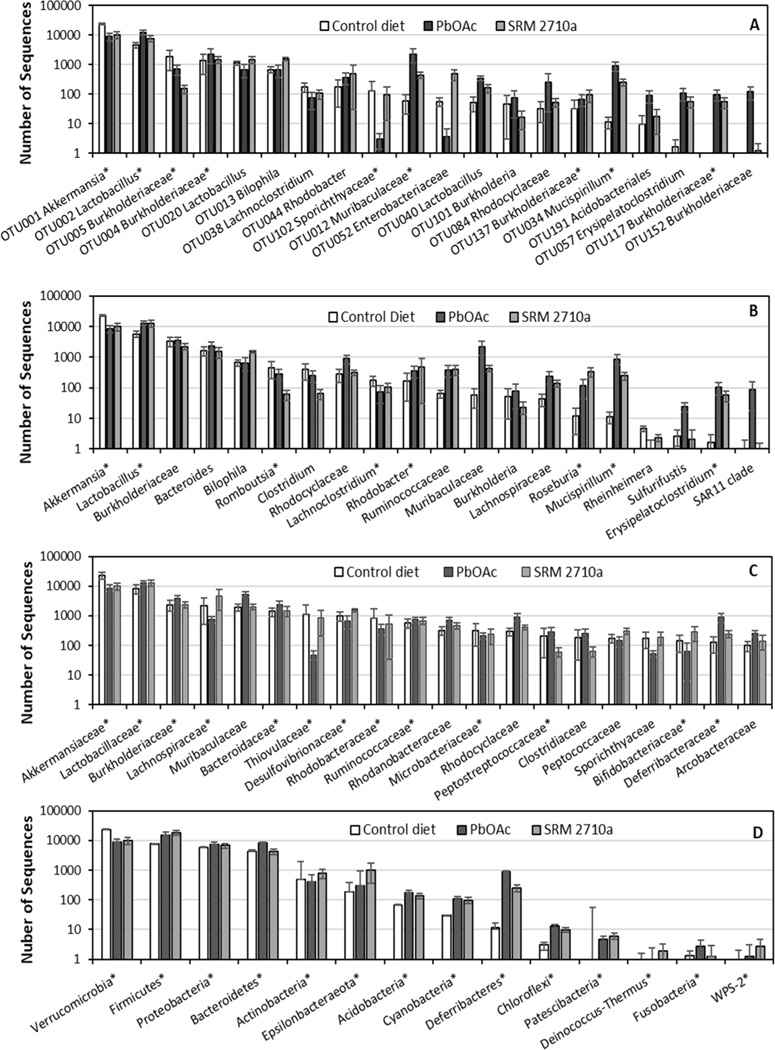
Fig. 2.
Cecal microbiome contributing to dissimilarity between control diet and treatments classified at taxonomic levels of OTU (A), genus (B), family (C), and phylum (D) selected by SIMPER analysis. The top twenty that contribute most to dissimilarity between PbOAC treatment and control are plotted. Values are mean numbers of sequences across treatment doses with error bars being the standard error of the mean. Control diet taxa are in rank order. Taxa identifications use the lowest taxon having a recognized name; asterisk indicates taxon was among the 20 top contributors to dissimilarity from control in SRM 2710a treatments.

