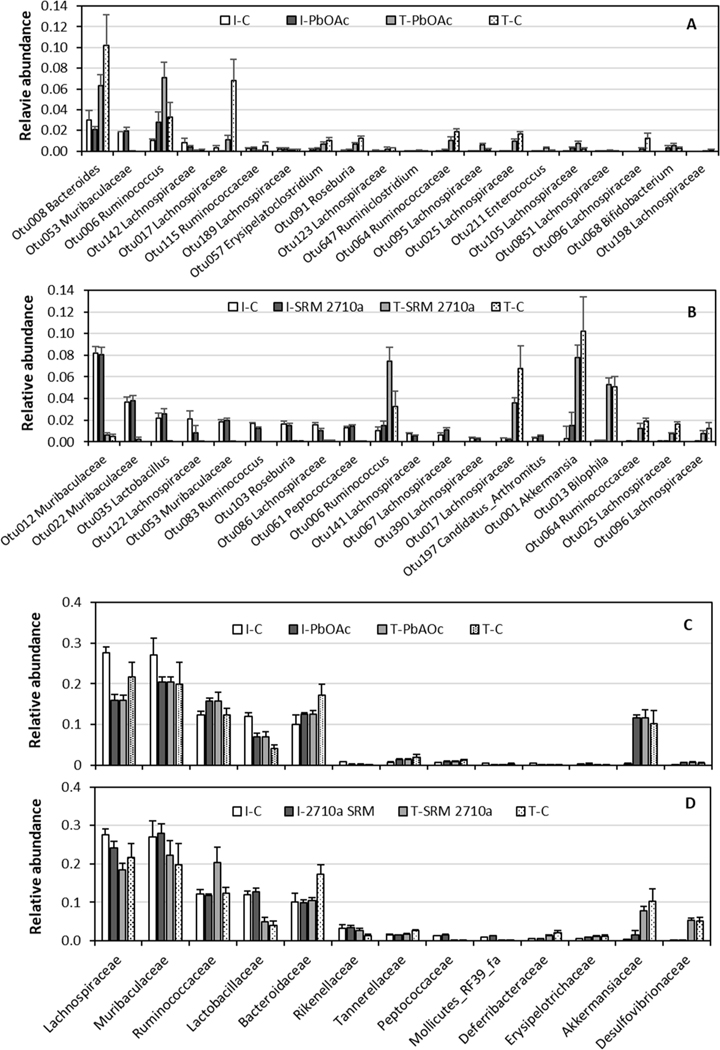
Fig. 3.
Relative abundance of fecal microbiomes: OTUs in PbOAc (A), OTUs in SRM 2710a (B), families in PbOAc (C), and families in SRM 2710a (D) selected by SIMPER analyses. Families with the most sequences in each treatment were selected for the plots. I=initial Day 2, T = terminal Day 9, C=control without dietary Pb. Nomenclature from SILVA. Values are means with error bars being the standard error of the mean.

