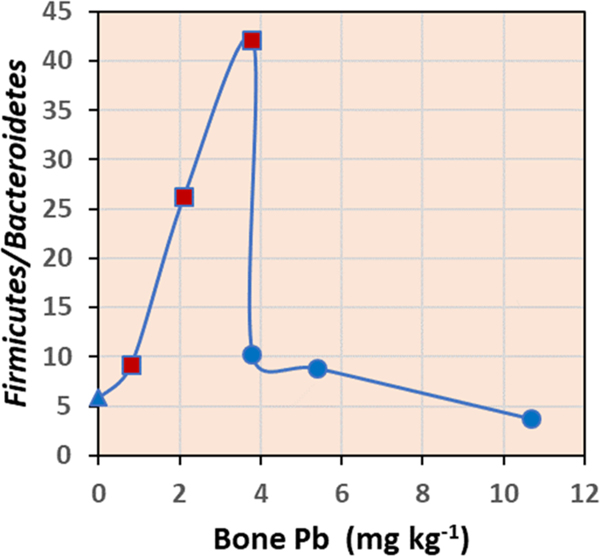
Fig. 4.
Changes of Firmicutes/Bacteroidetes relative abundance ratio with mouse bone Pb concentration. Bone Pb data were from Bradham et al. (2016). Blue triangle reprents the control, red squares SRM 2710a treatment, and blue circles PbOAc treatment.

