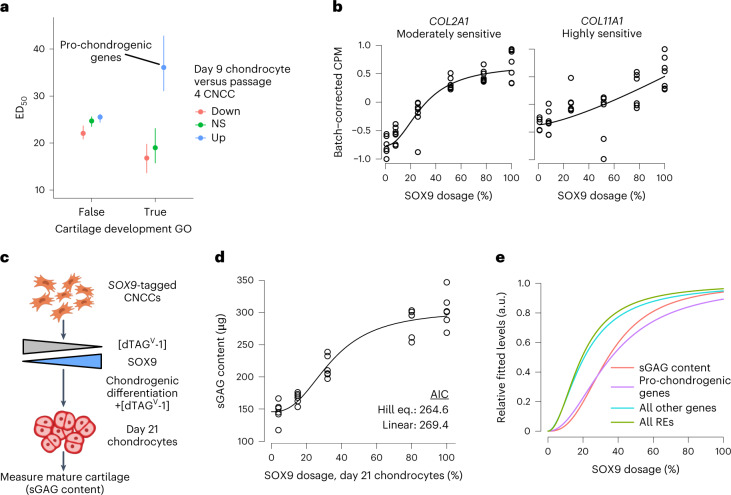
Fig. 5. The pro-chondrogenic program is sensitive to SOX9 dosage.
a, ED50 of SOX9-downregulated genes stratified by presence in the ‘Cartilage development’ Gene Ontology (GO) category (x axis), and expression change in chondrocytes compared to CNCCs (color, data from ref. 29). n of groups from left to right: 157, 269, 241, 6, 4, 11. Points and error bars represent median and 95% confidence intervals as computed by 200 bootstraps (see Methods). b, Examples of known pro-chondrogenic genes that are moderately or highly sensitive to SOX9 dosage. c, Schematic of approach to titrate SOX9 dosage during 21-day chondrogenic differentiation. d, Sulfated glycosaminoglycan (sGAG, representative of mature cartilage) content at day 21 of chondrogenesis as a function of SOX9 dosage as estimated in Extended Data Fig. 9b. Black curve represents Hill equation fit. e, Median dosage curves based on fitted ED50 and Hill exponents for all REs and genes, pro-chondrogenic genes (purple, labeled group in a) and sGAG content (from d).

