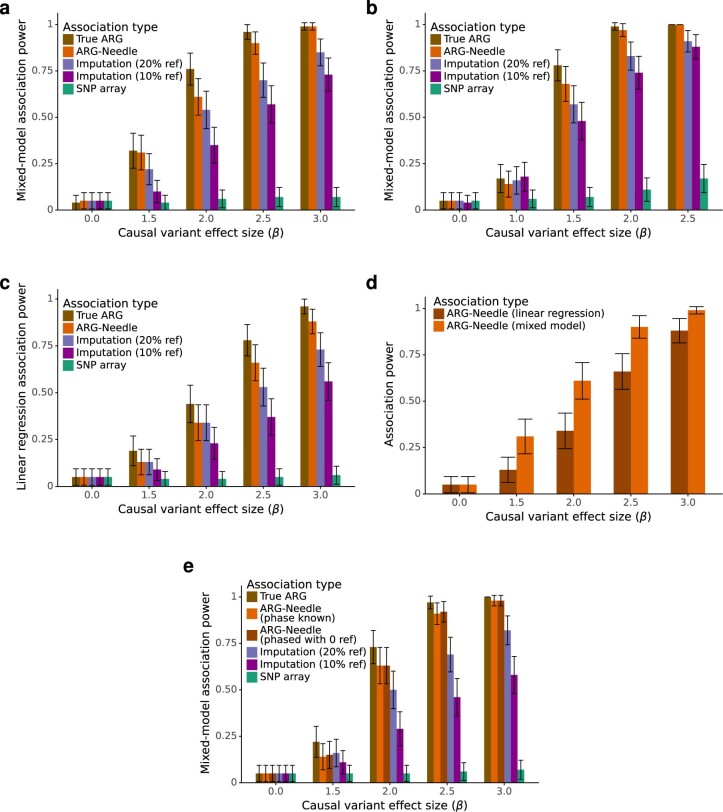
Extended Data Fig. 6. Additional simulations of ARG-MLMA genealogy-wide association power.
a. Similar to Fig. 3a, except with a low-frequency causal variant (MAF = 0.05%) and a smaller simulation with N = 10,000 haploid samples and 22 chromosomes of 2.5 Mb each. b. Similar to a, except with the causal variant MAF chosen to be 0.1%. c. Similar to a, except using linear regression instead of the linear mixed model to test for association. d. We combine the association power results of ARG-Needle association from a and c, highlighting the improvement of ARG-MLMA compared to directly testing ARG clades using linear regression. e. As in a, but with N = 10,000 diploid instead of N = 10,000 haploid individuals. ARG-Needle is run with the true phase known and with reference-free phasing. % ref indicates the size of the reference panel used for imputation as a percentage of the number of haploid samples (N = 10,000 in a-c, 2 N = 20,000 in e). All panels use 100 independent simulations to measure power. Data are presented as fractions ± 2 s.e.m.

