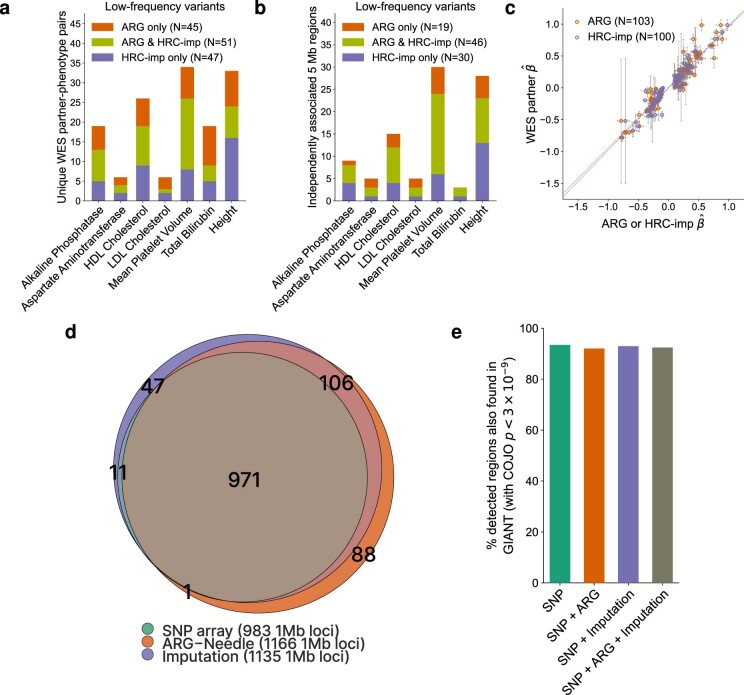
Extended Data Fig. 10. Additional results for low (0.1% ≤ MAF < 1%) and high frequency (MAF ≥ 1%) variant associations.
a-c. Association of ARG-derived and imputed low-frequency variants with 7 quantitative traits. a. Counts of unique WES partners for ARG and HRC + UK10K imputed (‘HRC-imp’) independent associations, partitioned by traits and showing overlap. b. Counts of implicated 5 Mb regions containing ARG and HRC + UK10K imputation independent associations, partitioned by traits and showing overlap. c. Scatter plot of estimated effect () for independent variants (estimated within 337,464 samples) against for their WES partners (estimated within 138,039 samples), with linear model fit. Error bars represent 1.96 s.e.m. d, e. Association of higher frequency variants with height. d. Venn diagram of number of 1 Mb regions containing a significant hit at P < 3 × 10⁻⁹ for ARG-Needle (MAF ≥ 1%, μ = 10−5), HRC + UK10K imputed (MAF ≥ 0.1%, info score > 0.3) and SNP array association. ARG-Needle association detected 971 out of 982 (98.9%) 1 Mb regions found by both imputation and array, 108 out of 153 (71%) 1 Mb regions found by imputation but not array and an additional 92 (8% increase upon 1140) 1 Mb regions to those already found by imputation and array. e. Percent of 1 Mb regions containing independent associations (defined as having COJO P < 3 × 10⁻⁹, see Methods) in association scans of 337,464 UK Biobank individuals that were also present in a GIANT consortium meta-analysis of ∼700,000 samples.

