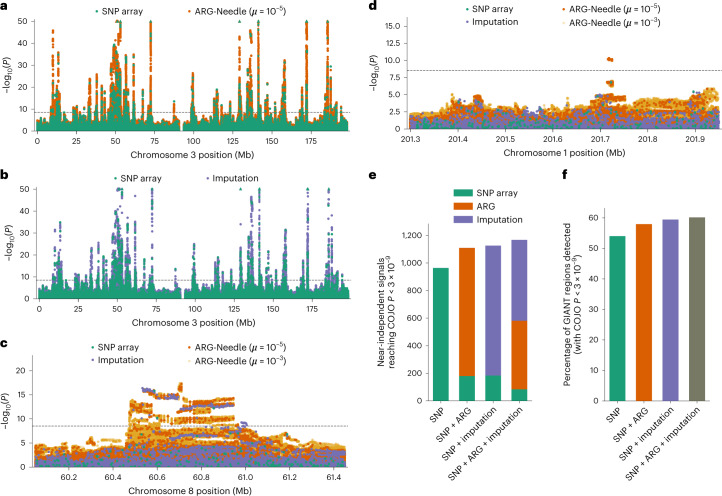
Fig. 5. Genealogy-wide association of higher frequency variants with height in UK Biobank.
a,b, Chromosome 3 Manhattan plots showing MLMA of ARG-Needle on SNP array data versus array SNPs (a) and HRC + UK10K-imputed variants versus array SNPs (b). c,d, Manhattan plots of two loci. c, ARG-MLMA detects haplotype structure that is found using imputation, with a different association peak. d, An association peak found by ARG-MLMA that was significant (P < 3 × 10⁻⁹) in a GIANT consortium meta-analysis of ~700,000 samples. e,f, Approximately independent associations (defined as having COJO P < 3 × 10⁻⁹; Methods) when considering array SNPs alone, array SNPs and ARG-Needle variants, array SNPs and imputed variants, and all three types of variants. e, Total number of independent variants found and attribution based on data type. f, Percentage of 1-Mb regions containing COJO associations in the GIANT meta-analysis that are detected using each method. For the Manhattan plots, the order of plotting is ARG-Needle with μ = 10−3 (used for follow-up), then ARG-Needle with μ = 10−5 (used for discovery), then imputation, then SNP array variants on top. Dotted lines correspond to P = 3 × 10⁻⁹ (Methods) and triangles indicate associations with P < 10−50. See also Supplementary Figs. 9 and 10.

