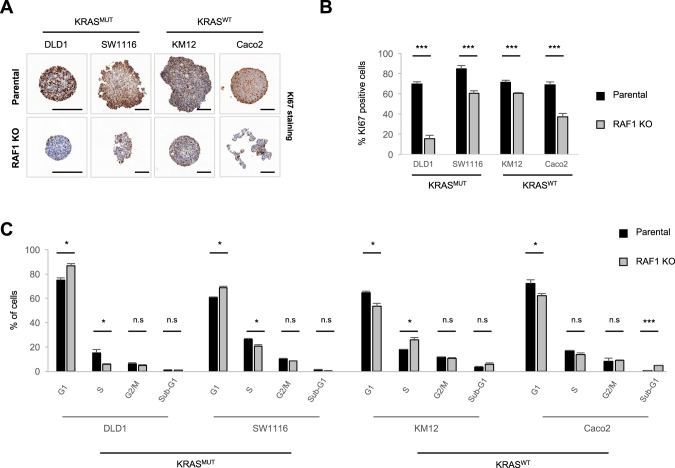
Fig. 2. Ablation of RAF1 results in cell cycle defects.
A KI67 staining of spheroids after 5 days in culture. KO pictures are representative of three independent clones/cell line. Scale bars = 200 µm. B Quantification of KI67-positive cells in parental and RAF1 KO spheroids. C 5 days after spheroid formation, spheroids were incubated with 10 µM EdU for 2 h, dissociated, fixed and stained. Cell cycle phases were determined using flow cytometry. RAF1 KO plot represents the three independent RAF1 KO clones for each cell line (n = 3 separate experiments). B, C, *p < 0.05, **p < 0.01, ***p < 0.001, n.s not significant.

