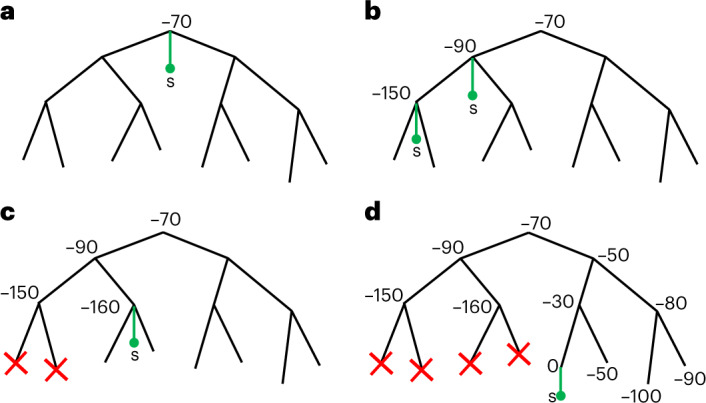
Fig. 3. Graphical summary of phylogenetic placement in MAPLE.

a, To search for the best placement of a new sample s (here represented by a green dot and branch) on the current tree, we first assess placement at the root, which in this case results in a relative log-likelihood score of −70. b, We iteratively visit descendant nodes by preorder traversal and assess placement for each visited node (in practice, we also attempt placement onto branches). c, When the log-likelihood score decreases two times consecutively and falls below a certain threshold relative to the best placement found so far, we do not visit further nodes downstream (red crosses). d, The placement with the highest score at the end of this process (in this case with cost 0) is taken as optimal for the addition of s to the tree.
