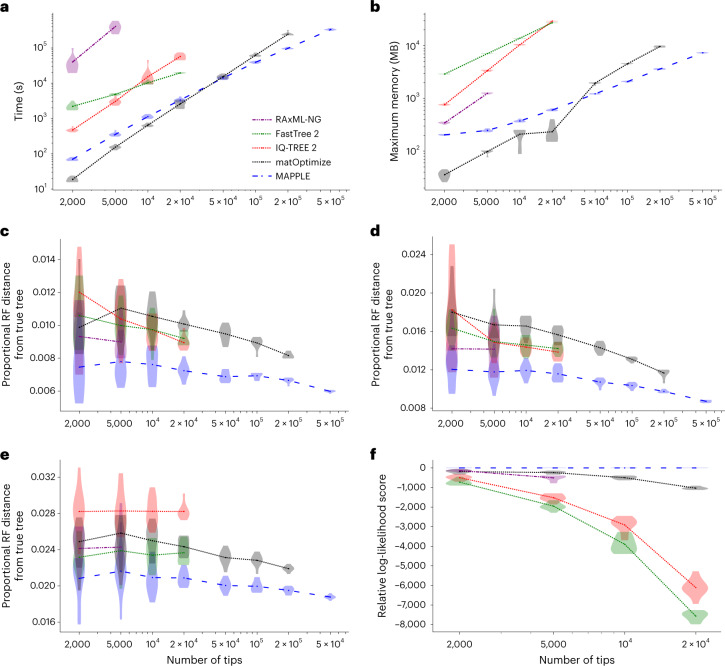
Fig. 4. MAPLE consistently delivers higher accuracy phylogenetic inference from SARS-CoV-2 genomes at lower computational demand.
a, Time required to run each method considered on real SARS-CoV-2 datasets. Each phylogenetic inference method considered is represented by a different color and line style (see legend). Values on the x axis show the number of samples included in each replicate. We ran each method up to the maximum dataset size that could be analyzed due to time (1 week) and memory (40 GB) limitations. Each violin plot summarizes values for ten replicates, and dots represent mean values. b, Maximum RAM demand required to run each method considered on real SARS-CoV-2 datasets. c–e, Proportional Robinson–Foulds (RF) distances between estimated trees and true trees in simulations. Higher values correspond to more errors in phylogenetic estimation. c, ‘Basic’ simulation scenario; d, ‘rate variation’ simulation scenario; e, ‘sequence ambiguity’ simulation scenario. f, Log-likelihoods (computed with IQ-TREE 2) of phylogenies inferred by different methods on real SARS-CoV-2 data, relative to the highest log-likelihood score obtained by any method for the same replicate. Higher values on the y axis represent more likely estimates. We consider only datasets of up to 20,000 samples due to the computational demand of likelihood evaluation.

