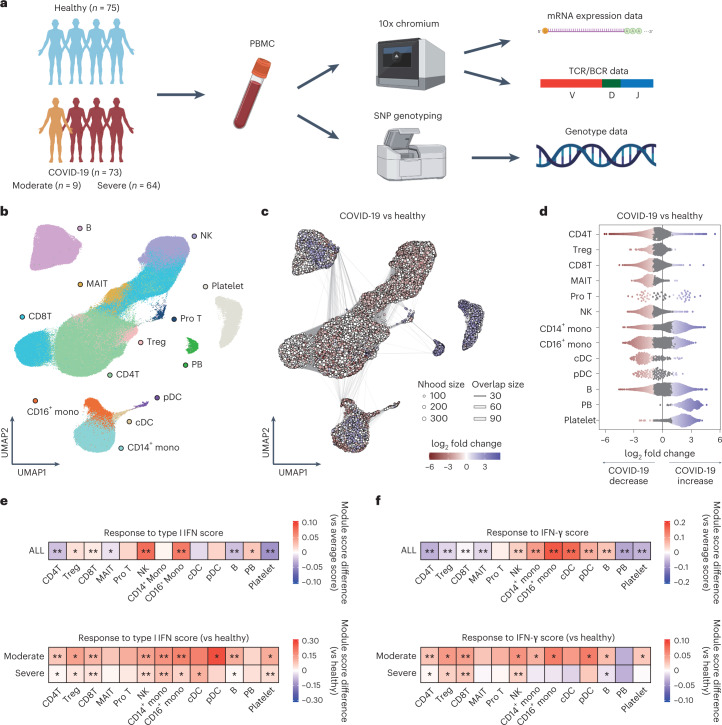
Fig. 1. Study design and single-cell transcriptional analysis of PBMCs from COVID-19 patients and healthy controls.
a, Overview of the study design. The image was created using BioRender.com. b, UMAP embedding of scRNA-seq data for all 895,460 cells. Thirteen cell types were defined by RNA expression of marker genes (Extended Data Fig. 1a). c, Graph representation of Nhoods identified by Milo. Nodes are Nhoods, colored by their log2 FC between COVID-19 patients (n = 72) and healthy controls (n = 75) adjusted by age and sex. Nondifferential abundance Nhoods (FDR ≥ 0.1) are colored white, and sizes correspond to the number of cells in a Nhood. Graph edges depict the number of cells shared between adjacent Nhoods. d, Beeswarm plot showing the distribution of adjusted log2 FC in abundance between COVID-19 patients and healthy controls in Nhoods according to 13 cell types. Colors are represented in the same way as in c. e,f, The module score of Type I IFN response and IFN-γ response in PBMCs. The score was calculated using a gene set termed ‘GOBP_RESPONSE_TO_TYPE_I_INTERFERON’ (GO:0034340) and ‘GOBP_RESPONSE_TO_INTERFERON_GAMMA’ (GO:0034341), respectively. Upper heatmaps depicting the difference between average scores of 13 cell types and that of all single cells. The module scores of cells in each cell type were compared with the average score of all PBMCs using a two-sided one-sample t-test. Lower heatmaps depicting the difference between average scores of moderate or severe disease group and those of the healthy group in each of 13 cell types (n = 75 healthy, n = 9 moderate, n = 64 severe). The module scores of cells of moderate or severe disease group were compared to those of healthy group in each cell type using a two-sided Welch’s t-test. *Puncorrected < 1.0 × 10−50, **Puncorrected < 1.0 × 10−300. Mono, monocytes; Pro, proliferative; Nhood, neighborhood.

