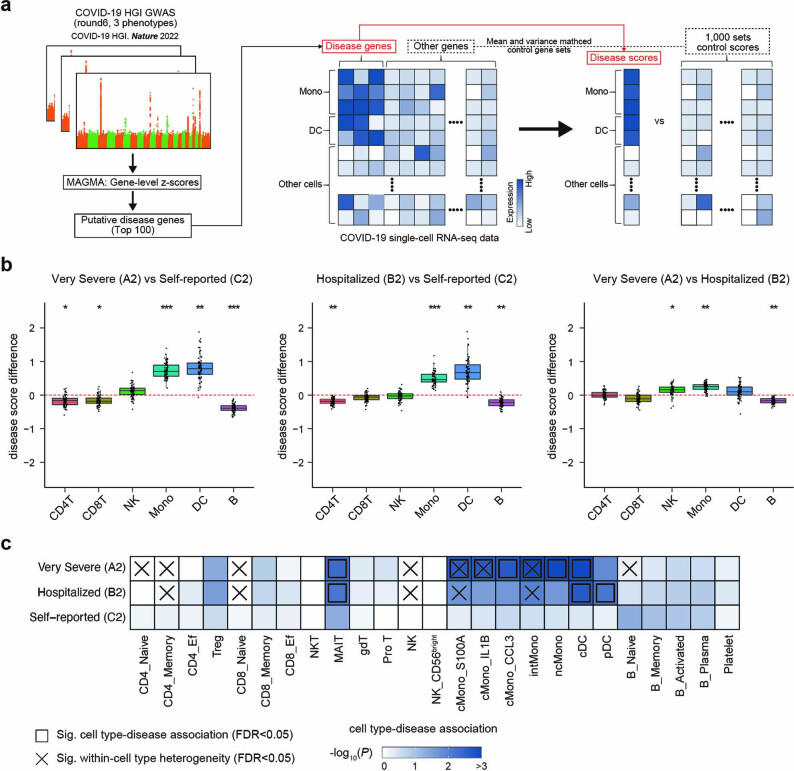
Extended Data Fig. 6. Assessing the association of PBMC cell types with host genetic risk.
(a) Flowchart of integrated analysis of scRNA-seq data and COVID-19 HGI (round6) GWAS summary statistics using scDRS. The figure design is based on the original paper of scDRS41. (b) Differences of scDRS disease score between COVID-19 phenotypes in six major cell types. Differences of average disease scores of each sample were evaluated using two-sided paired t-test (adjusted for multiple comparisons using Bonferroni’s correction across all pairs of six cell-types and three GWAS comparisons, *P < 1×10⁻¹⁰, **P < 1×10-20, ***P < 1×10-30). Boxes denote the interquartile range (IQR), and the median is shown as horizontal bars. Whiskers extend to 1.5 times the IQR, and all COVID-19 patients (n = 72) are shown as individual points. (c) Heatmaps depicting cell type-disease association for three phenotypes in the manually annotated 25 clusters of COVID-19 scRNA-seq dataset. Heatmap colors denote uncorrected P-value of cell type-disease association evaluated using scDRS. Squares denote significant cell type-disease associations (FDR < 0.05), and cross symbols denote significant heterogeneity in association with disease across individual cells within a given cell type (FDR < 0.05). FDR was calculated via the Benjamini-Hochberg method across all pairs of 25 cell types and three GWAS phenotypes.

