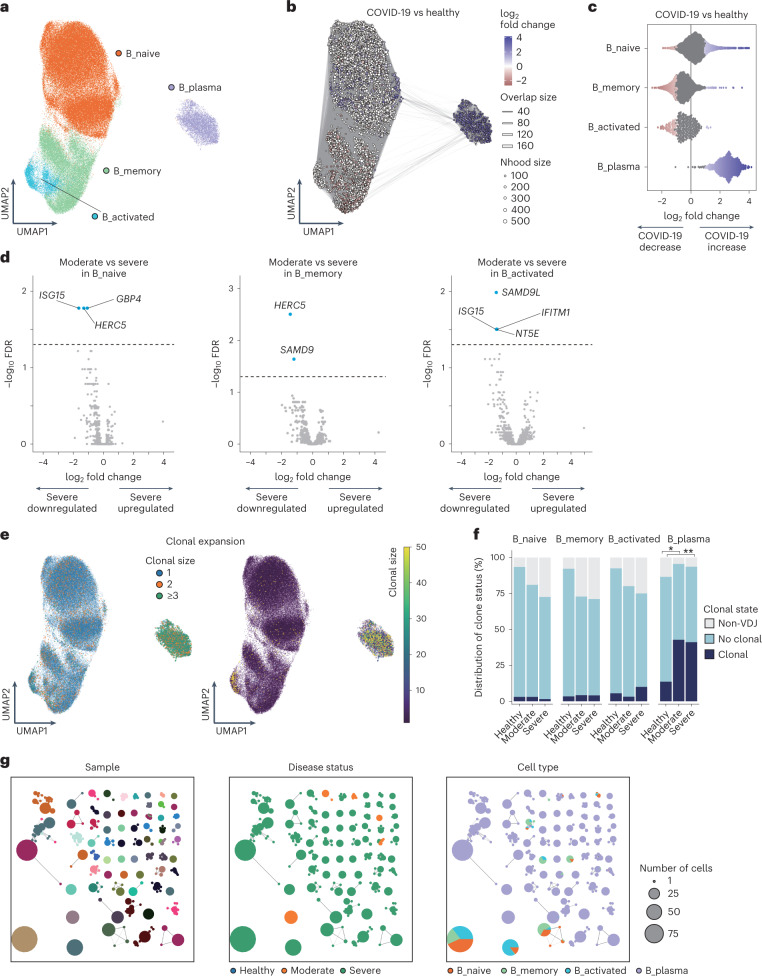
Fig. 4. Differential abundance, gene expression and clonal analysis of B cells.
a, UMAP embedding of four cell types of 123,728 B cells (Extended Data Fig. 4a). b, Graph representation of Nhoods identified by Milo. Nodes are Nhoods, colored by their log2 FC between COVID-19 (n = 72) and healthy controls (n = 75) adjusted by age and sex. Nondifferential abundance Nhoods (FDR ≥ 0.1) are colored white. c, Beeswarm plot showing the distribution of adjusted log2 FC in abundance between COVID-19 and healthy controls in Nhoods according to four cell types. d, The differential gene expression analysis between moderate (n = 8) and severe (n = 64) COVID-19 in B_naive, B_memory and B_activated. DEGs (FDR < 0.05 and FC > 2) are colored in light blue and labeled by gene symbols. e, UMAP embedding of B cells colored by clonal expansion size. Left panel shows clonal expansion divided into three categories, and right panel shows clonal expansion size from 0 to 50. f, The distribution of the clone state of B cells in each cluster according to disease status. Differences of average clonal expansion rate of each sample between disease status were evaluated in each cluster using two-sided Welch’s t-test (*Puncorrected = 0.012, **Puncorrected = 1.3 × 10⁻⁷), where only cells mapped with BCRs were included in the analysis (n = 75 healthy, n = 9 moderate, n = 64 severe). g, Network plots showing similarity of CDR3 amino acid sequence in BCR heavy and light chain for each sample, disease status and cell types. Clonotype clusters with clonal size ≥10 are selected.

