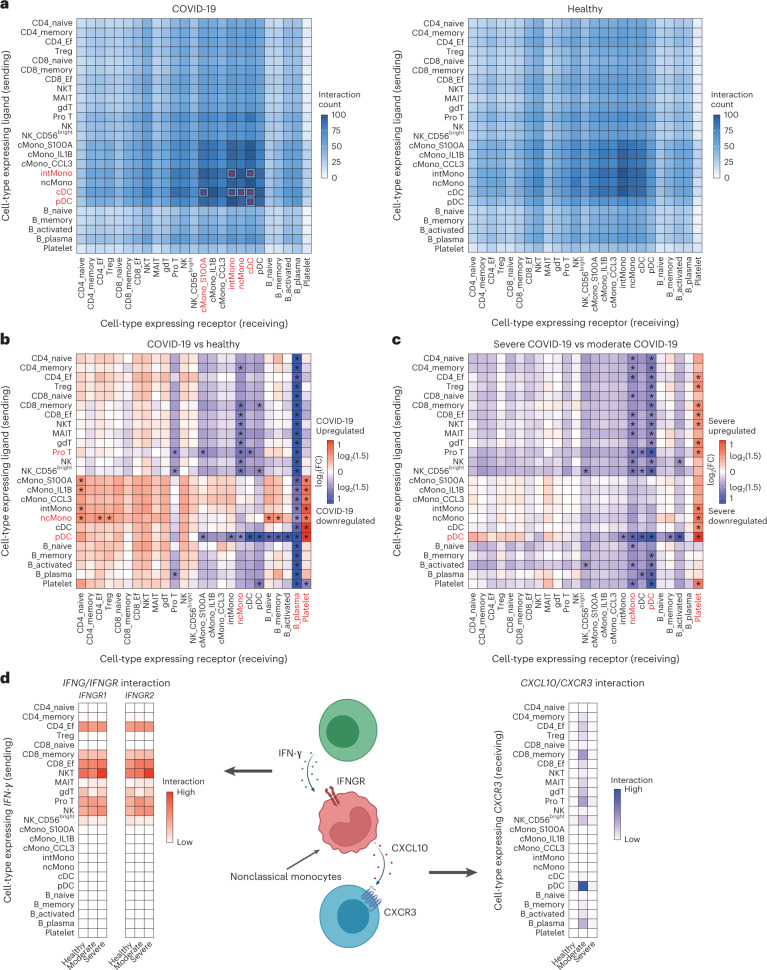
Fig. 5. Differential cell–cell interactions between COVID-19 patients and healthy controls and within COVID-19 severity.
a, Heatmaps depicting number of ligand–receptor pairs connecting cell–cell pairs for COVID-19 (n = 73) and healthy controls (n = 75), respectively. Rows indicate cells expressing the ligands and columns indicate cells expressing the receptors. An asterisk indicates cell–cell interactions with a number of ligand–receptor of more than 100, and cell types that share such interactions with at least one cell type are highlighted in red. b, Heatmap depicting the cell-connectivity-summary networks based on mean expression weight between COVID-19 (n = 73) and healthy controls (n = 75). An asterisk indicates the cell–cell interactions with FC of mean expression ≥1.5, and cell types that share cell–cell interactions with FC of mean expression ≥1.5 with five or more cell types are highlighted in red. c, Heatmap depicting the cell-connectivity-summary networks based on mean expression weight between moderate (n = 9) and severe (n = 64) COVID-19. An asterisk and red highlight mean the same as in b. d, Cell–cell interaction of IFNG/IFNGR and CXCL10/CXCR3 around nonclassical monocytes. Heatmaps depicting the cell-connectivity-summary networks based on mean expression weight of IFNG/IFNGR (left) and CXCL10/CXCR3 (right) according to three conditions, respectively (n = 75 healthy, n = 9 moderate, n = 64 severe). The image was created using BioRender.com. Ef, effector.

