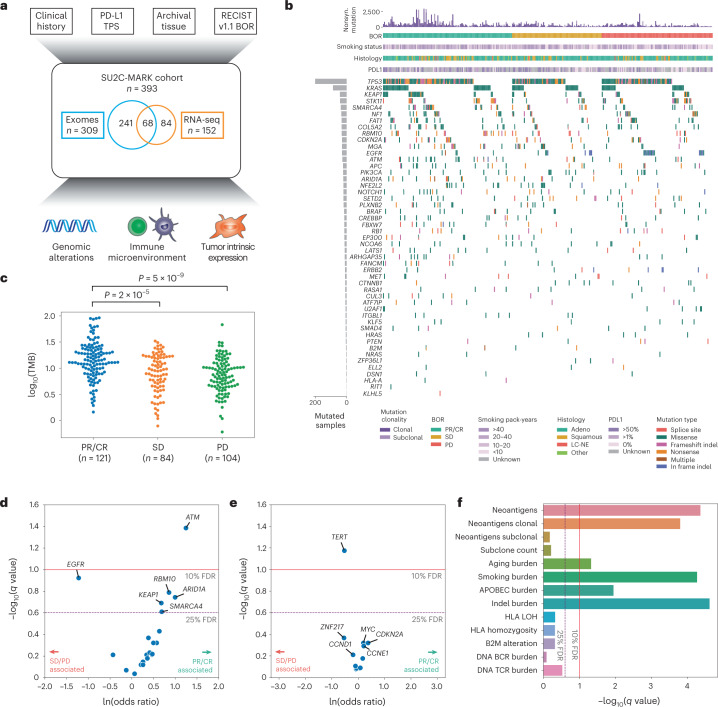
Fig. 1. Overview of the SU2C-MARK cohort and initial genomic characterization.
a, Overview of clinical and genomic data collected across the SU2C-MARK cohort (n = 393 patients). b, CoMut plot of SU2C-MARK cohort organized by response category. c, Log10 of the TMB as a function of response category. Significance was assessed via a two-sided Mann–Whitney U test. d, Volcano plot of logistic regression results for oncogenic mutations in known lung cancer drivers and binned BOR category comparing patients with a PR or CR to patients with SD or PD. ATM alterations reached significance (q < 0.1, Benjamini–Hochberg), while EGFR, RBM10, ARID1A, KEAP1 and SMARCA4 were all near significance (q < 0.25). e, Volcano plot of logistic regression results for gene-level copy number. Focal amplifications of TERT as well as the cytoband it is located on, 5p15.33 (Extended Data Fig. 3b), are associated with resistance to checkpoint blockade. f, Summary of exome-derived genomic features and logistic regression with response. Neoantigens were estimated using NetMHCpan-4.0 (ref. 60) following HLA allele identification with POLYSOLVER61. Subclone count was assessed via PhylogicNDT62. Aging, smoking and APOBEC burdens were calculated based on the mutation burden attributable to these processes (SBS5, SBS4 and SBS13, respectively) following mutational signature analysis (Extended Data Fig. 4 and Methods). HLA was estimated via LOHHLA24. B- and T-cell rearranged receptor abundance was estimated via MiXCR27. LOH, loss of heterozygosity; TMB, tumor mutation burden; PR, partial response; CR, complete response; SD, stable disease; PD, progressive disease.

