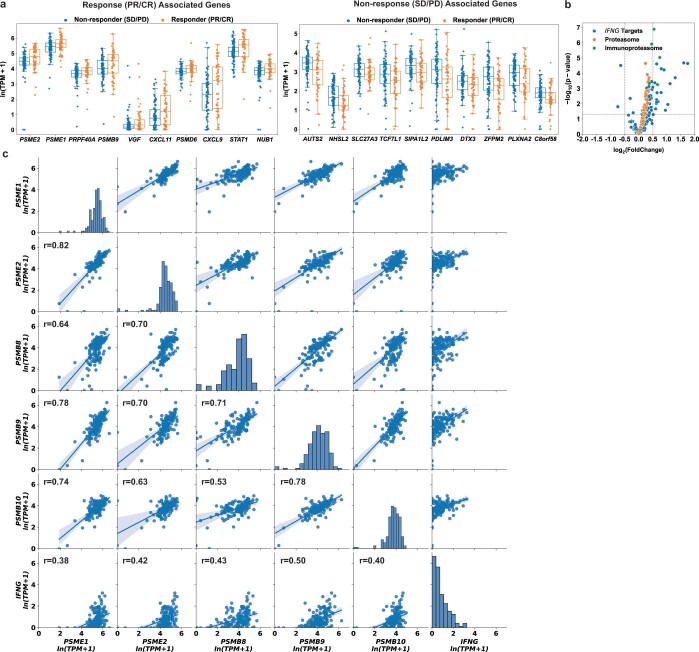
Extended Data Fig. 5. Extended response and resistance associated genes and signatures in the SU2C-MARK Cohort.
(a) Expression of top 10 significant protein-coding transcripts associated with response (PR/CR, left; N = 52 RNA samples) and nonresponse (SD/PD, right; N = 84 RNA samples). Boxplot overlay depicts 25th percentile (minima), 50th percentile (center), and 75th percentile (maxima) of distribution with whiskers bounding points within 1.5 X interquartile range (Q3–Q1) from each minimum and maximum. PR = Partial Response, CR = Complete Response, SD = Stable Disease, PD = Progressive Disease, TPM = transcripts per million (b) Volcano plot for Limma results for cohort wide analysis subsetted to Interferon Targets, Proteasome Subunits, and Immunoproteasome Subunits. (c) Scatterplots comparing 5 inducible components of the immunoproteasome against each other as well as IFNG. Regression line and bootstrapped 95% confidence interval are displayed.

