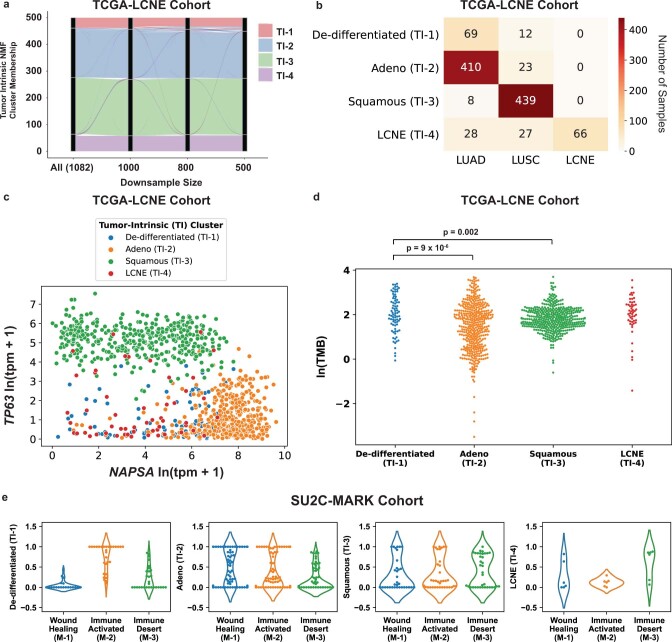
Extended Data Fig. 8. Extended analysis of Tumor-Intrinsic (TI) subtypes.
(a) Alluvial plot of Tumor Intrinsic (TI) subtype downsampling analysis ranging from full TCGA-LCNE cohort (N = 1082) to under 50% downsample (N = 500). The TCGA-LCNE cohort comprises TCGA lung adenocarcinoma (LUAD), lung squamous cell carcinoma (LUSC), and published large cell neuroendocrine (LCNE)63 cohorts. Both overall distribution and individual sample membership were well preserved across downsamples. (b) Confusion matrix of TCGA-LCNE cohort comparing TI subtype assignment with study source. The novel de-differentiated (TI-1) subtype included predominantly TCGA LUAD samples, with a smaller contribution from TCGA LUSC. (c) Expression scatterplot of canonical adenocarcinoma and squamous cell carcinoma markers, NAPSA (Napsin A) and TP63 (encoding both p40 and p63), respectively, across the TCGA-LCNE Cohort. Samples are colored by TI cluster assignment, with neither de-differentiated (TI-1) nor LCNE (TI-4) samples showing strong canonical lineage marker expression. TPM = transcripts per million. (d) Tumor mutation burden (TMB) for Tumor Intrinsic subtypes TI-1 (N = 81 patients), TI-2 (N = 433 patients), TI-3 (N = 447 patients), and TI-4 (N = 55 patients) in the TCGA-LCNE Cohort. The De-differentiated (TI-1) subtype had an increased mutation burden compared to the Adeno (TI-2) and Squamous (TI-3) subtypes (p = 9 ×10⁻⁶ and p = 0.002, respectively, two-sided Mann–Whitney U test). (e) Violinplots of Tumor Intrinsic signatures by membership in Microenvironment clusters M-1 (N = 52 RNA samples), M-2 (N = 56 RNA samples), and M-3 (N = 44 RNA samples).

