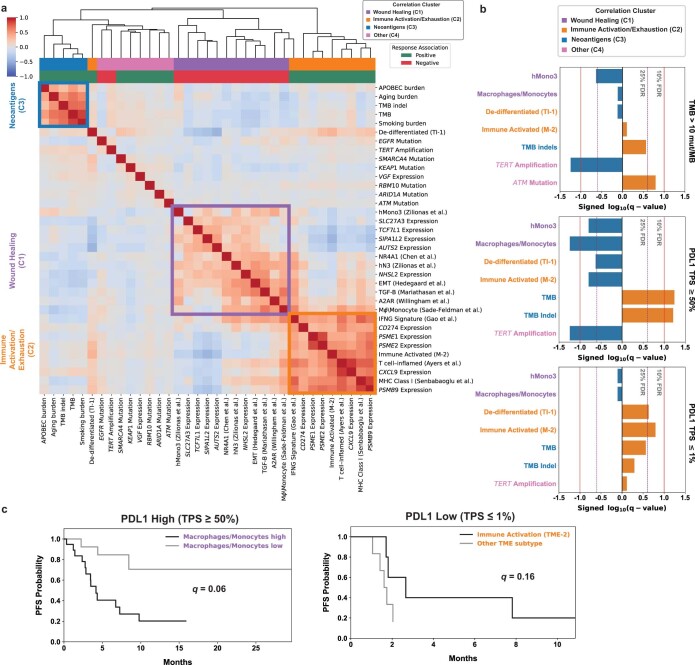
Extended Data Fig. 9. Evaluation of correlation in TCGA data between top SU2C-MARK predictors and assessment of their ability to further stratify clinically relevant subgroups of the SU2C-MARK cohort.
(a) Cross-correlation heatmap of the top response and resistance associated features in the SU2C-MARK cohort as assessed in TCGA LUAD and LUSC combined datasets (N = 1018)35,45–50. Correlation cluster and response association colorbars based on designations in the SU2C-MARK cohort are plotted. Unsupervised hierarchical clustering re-identifies the previously recognized feature clusters corresponding to Wound Healing (C1), Immune Activation/Exhaustion (C2), and Neoantigens (C3). Nearly all features retain their original cluster designations (the relocation of the De-Differentiated TI-1 signature may relate to its association with high mutation burden as described earlier). (b) Contribution of SU2C-MARK predictors to clinically relevant biomarker subsets. The addition of features from the Wound Healing (C1) and Immune Activation/Exhaustion (C2) clusters meaningfully stratify traditionally favorable (for example, PDL1 high) and unfavorable (for example, PDL1 low) clinical subgroups (q = 0.06 and q = 0.16, respectively, Benjamini–Hochberg adjusted logrank test). TMB = Tumor Mutation Burden. (c) Association of top genomic predictors from SU2C-MARK cohort with Progression-Free Survival (PFS) for clinically relevant subgroups of NSCLC, namely high TMB ( > 10 mut/MB, top; favorable), high PD-L1 tumor proportion score (PDL1 TPS) corresponding to PDL1 TPS ≥ 50% (middle; favorable), and low PD-L1 expression (PDL1 TPS ≤ 1%, bottom; unfavorable). Signed FDR q-values based on Benjamini–Hochberg adjustment of logrank p-values are plotted for each feature (Methods).

