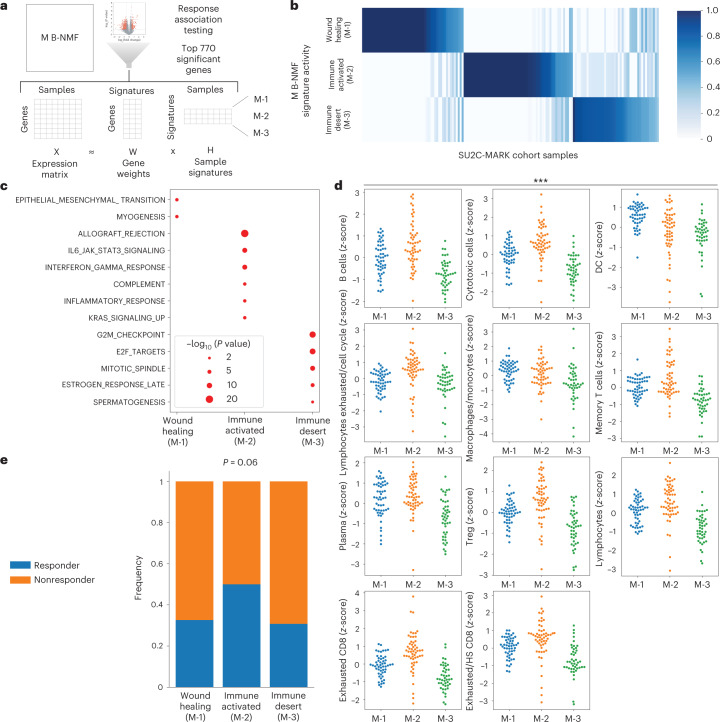
Fig. 3. Derivation of M subtypes and association with checkpoint blockade response.
a, Overview of M signature generation using B-NMF. b, H-matrix of SU2C-MARK samples and normalized M signature activity from semisupervised B-NMF. c, Dot plot of hallmark GSEA results for B-NMF-derived M signatures. Nominal P values from the one-sided hypergeometric test are shown. d, Swarmplots of selected tumor-associated immune cell signatures by M clusters. Myeloid cells were generally enriched in the wound healing (M-1, n = 52 RNA samples) subtype, while most immune cell types were enriched in the immune-activated (M-2, n = 56 RNA samples) subtype and depleted in the immune desert (M-3, n = 44 RNA samples) subtype (P < 0.001 for all signatures, Kruskal–Wallis test). e, Response rate by M subtype. The immune-activated (M-2) subtype was enriched for responders compared to the wound healing (M-1) and immune desert (M-3) subtypes (P = 0.06, one-sided Fisher’s exact test).

