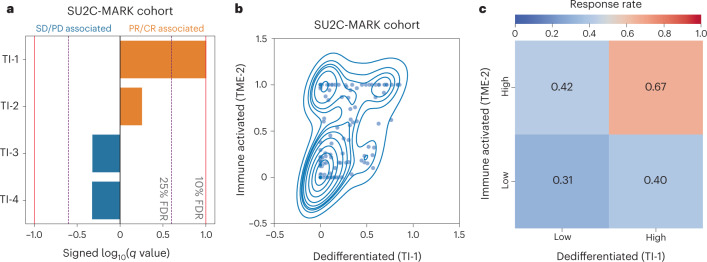
Fig. 5. Association between TI signatures, M signatures and response in the SU2C-MARK cohort.
a, Logistic regression analysis summary in the SU2C-MARK cohort between TI signatures and binned response category (PR/CR versus SD/PD). The dedifferentiated (TI-1) signature showed a significant association with response (q < 0.1, logistic regression with Benjamini–Hochberg adjustment). b, Kernel density estimate plot of the association between the activities of the dedifferentiated (TI-1) signature and the previously identified immune-activated (M-2) signature. c, Response rate in the SU2C-MARK cohort binned by expression of TI-1 and M-2 signatures. Patients with both high TI-1 and high M-2 show the highest response rate.

