Fig. 3.
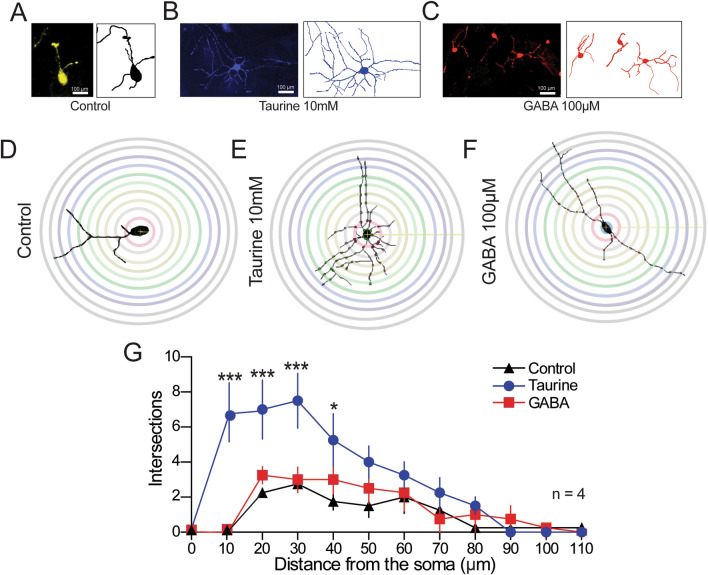
Representation of the Sholl analysis. A–C Microphotographs of representative NPC-SVZ in the three experimental conditions showing the typical neurite outgrowth and their corresponding digital reconstructions. D–F Schematic representation of the morphometric Sholl analysis performed on control, taurine- and GABA-treated cells. G The number of intersections between neurite outgrows and concentric rings (10 μm increments) from the center of the soma were used to determine primary, secondary, and tertiary ramifications (n = 5). *P < 0.05; ***P < 0.001

