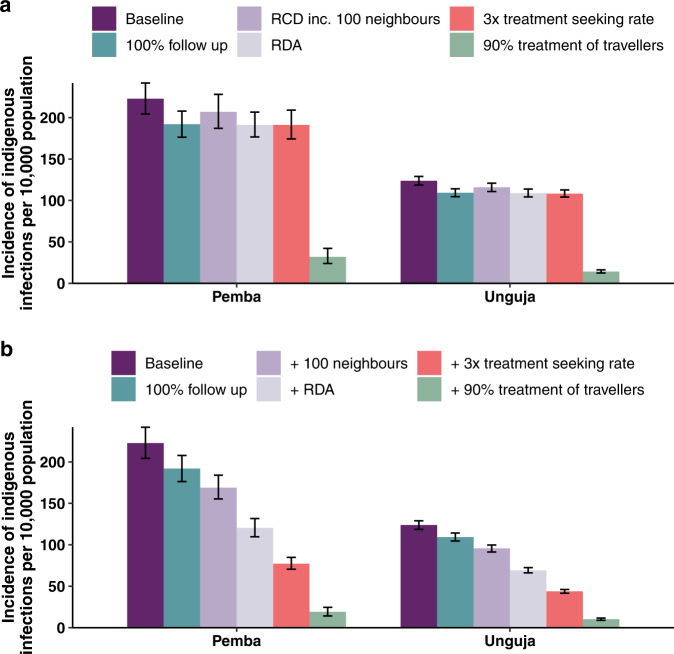
Fig. 3. Simulated annual malaria incidence 15 years after the start of interventions.
Median annual incidence of indigenous infections per 10,000 population in the 15th year after the start of interventions. The height of the bar represents the median value across n = 500 simulations per intervention scenario. The error bars represent the 95% prediction interval in the annual incidence. ‘Baseline’ refers to RCD with 35% follow-up of index cases at the index household. a Bar plot showing the final incidence after the implementation of each intervention on its own (n = 500 simulations per scenario). b Bar plot showing the final incidence when, going from left to right, each new intervention is layered on top of the last intervention (n = 500 simulations per scenario). ‘RCD’ stands for reactive case detection. ‘RDA’ stands for reactive drug administration.

