Figure 4.
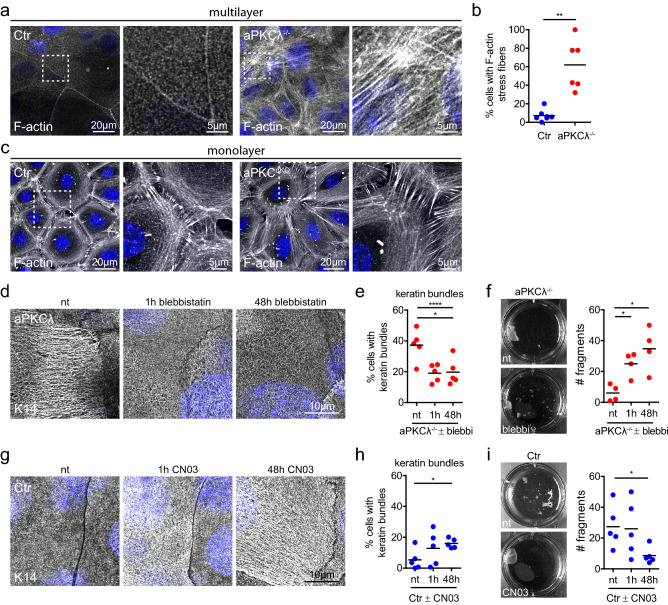
Actomyosin contractility determines keratin bundling and resilience. (a) Immunofluorescence analysis for F-actin in stratified keratinocyte cultures (48 h Ca2+). Nuclei labeled with DAPI (blue). (b) Quantification of cells with F-actin stress fibers. P = 0.0012, Mann–Whitney test, Ctr: n = 7, aPKCλ−/−: n = 6. Dots represent biological replicates. (c) Immunofluorescence analysis for F-actin in keratinocyte monolayers (6 h Ca2+). Nuclei labeled with DAPI (blue). Representative example of > 3 biological replicates. (d) Immunofluorescence analysis of keratin14 (K14) in aPKCλ−/− keratinocytes upon inhibition of actomyosin contractility (blebbistatin), treated for either 48 h or 1 h prior to fixation. (e) Quantification of cells with bundled keratin filaments as shown in d. *P < 0.05 with 1-way ANOVA, Tukey´s post test for Ctr/aPKCλ−/− each condition n = 5. (f) dispase assay of stratified aPKCλ−/− sheets (48 h Ca2+) and quantification of sheet fragments after sonication upon blebbistatin treatment (5 µM) for indicated timepoints prior to dispase treatment. *P < 0.05 with Mann–Whitney for n = 4. (g) Immunofluorescence analysis of K14 bundling in Ctr keratinocytes upon Rho activation (CN03), treated for either 48 h or 1 h prior to fixation. (h) Quantification of cells with stressed appearance of keratin filaments as shown in (g). *P < 0.05 with 1-way ANOVA, Tukey´s post test for Ctr/aPKCλ−/− each condition n = 5. (i) Dispase assay of stratified Ctr sheets (48 h Ca2+) and quantification of sheet fragments after sonication upon Rho activator treatment (CN03) for indicated timepoints prior to dispase treatment. *P < 0.05 with Student’s t-test for “nt” vs. “48 h”, n = 5. Dots represent biological replicates.

