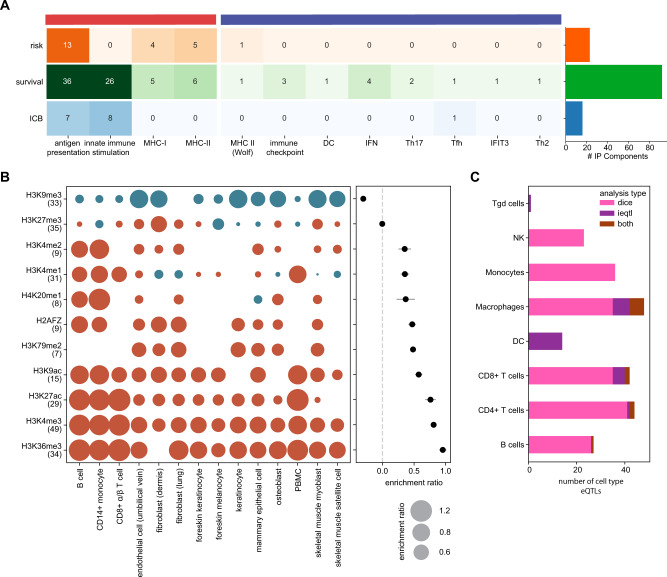
Fig. 6. Characterization of TIME eQTLs using in genetic models.
A Cancer relevant associations by category with barplot showing the total number of genes implicated by polygenic risk scores (PRSs), polygenic survival score (PSS) and polygenic ICB score (PICS). B Mean enrichment ratio of genetic model immune microenvironment variants in 11 histone marks with corresponding enrichment ratios in 14 specific cell types. Number of cell types analyzed for each histone mark are given. C Barplot of cell-type specific TIME eQTLs implicated by DICE and ieQTL analysis. Source data are provided in the Source Data file.

