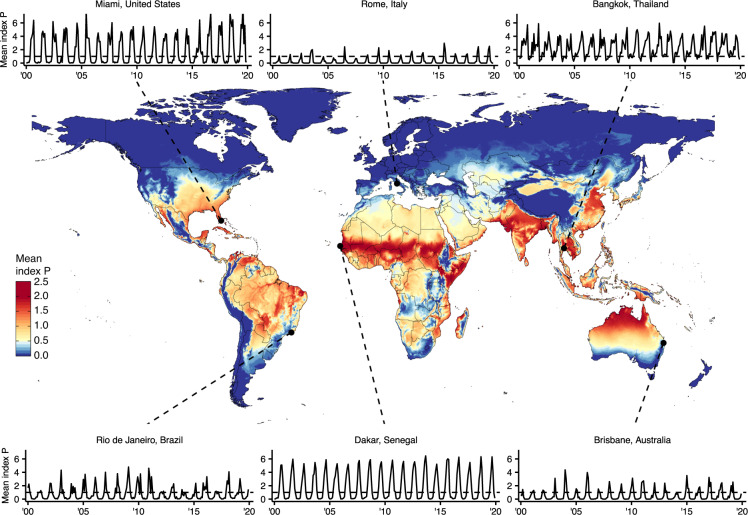
Fig. 2.
Summary of global spatiotemporal maps of estimated Index P for DENV transmitted by Aedes aegypti mosquitoes. Global map of mean Index P during a typical year at a spatial resolution of 0.25° × 0.25° (~28 km2). Includes time series of average monthly Index P from 2000 to 2019 for six cities: Bangkok, Thailand; Brisbane, Australia; Dakar, Senegal; Miami, United States; Rio de Janeiro, Brazil; and Rome, Italy. Cities were selected to capture the diversity of Index P dynamics observed globally across regions where DENV is endemic, emerging or absent.

