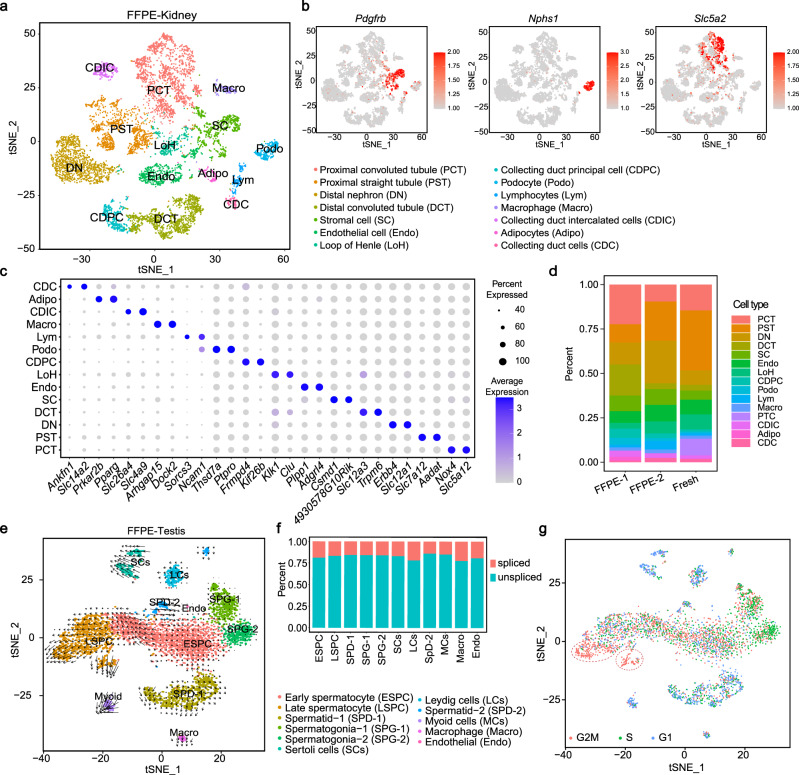
Fig. 4. Cell heterogeneity revealed in FFPE mouse tissues by snRandom-seq.
a t-SNE analysis of nuclei isolated from FFPE mouse kidney sample by snRandom-seq based on their gene expressions and colored by identified cell types. Fourteen Cell types identified were colored and shown below. b Expression of selected three cell-type markers in single nuclei in the t-SNE maps of FFPE mouse kidney. Gene expression levels are indicated by shades of red. c Dot plot of the average expressions of top two markers in each of the 14 cell types. d Proportion of annotated cell types of FFPE1, FFPE2, and fresh samples by snRandom-seq. e t-SNE and RNA velocity analysis of snRNAs from FFPE mouse testis by snRandom-seq. Velocity is shown as black arrows in different cell types by separate colors. The black arrows indicate RNA maturation trajectory. f Percents of spliced and unspliced transcripts in different cell types. g Cell cycle analysis of FFPE mouse testis by snRandom-seq. Points in t-SNE were colored by identified cell cycle phases (G1, G2M, or S). Red dashed circle: two subpopulations of late spermatocytes at the G2M phase with active transcriptional activity. Source data are provided as a Source Data file.

