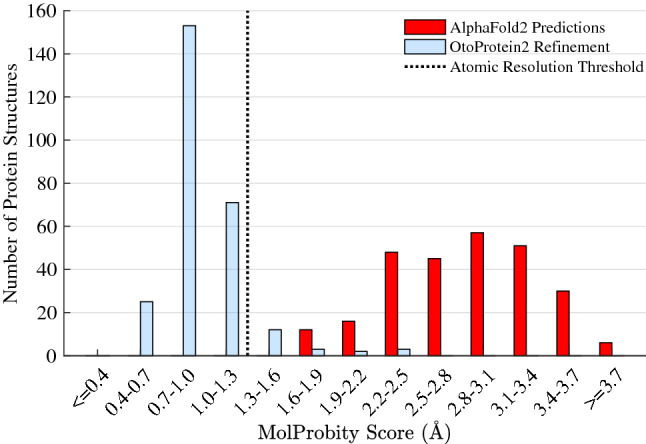
Fig. 2.

MolProbity score histogram for the OtoProtein2 database. Before optimization (red), the mean MolProbity score of the models is 2.86 and after optimization (blue) the structures are consistent with atomic resolution at a mean MolProbity score of 0.97. MolProbity scores are calibrated to reflect the expected crystallographic resolution of the diffraction dataset employed to create a protein structural model (i.e., a MolProbity score of 1.0 indicates that the structure is consistent with 1.0 Å resolution X-ray diffraction data)
