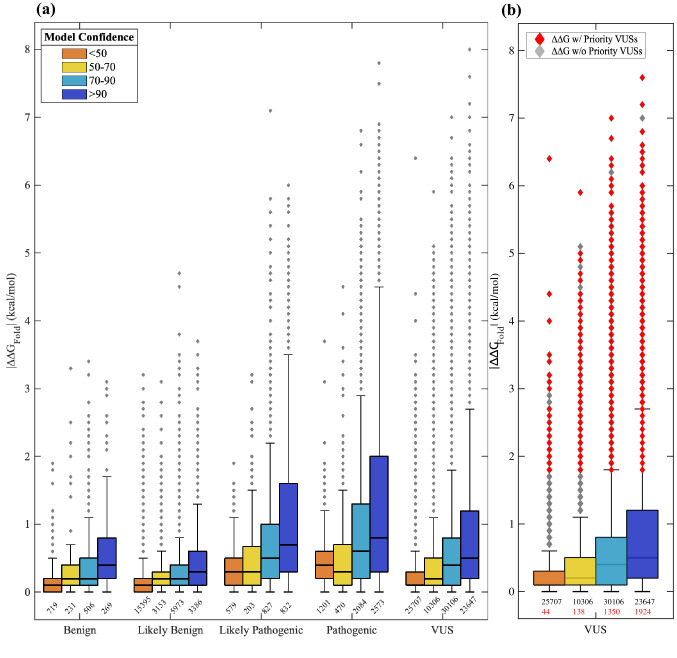
Fig. 3.
The range of ∆∆GFold predictions for missense variants in the Deafness Variation Database (DVD). a Box plots are grouped based on DVD pathogenicity classification and bars are colored based on the structure confidence at the variant’s amino acid position. Pathogenic variants and variants in confident portions of protein models have a larger distribution of ∆∆GFold than the benign and low confidence (e.g., usually solvent exposed) counterparts. The number of observations belonging to each box is printed below the box, and each outlier in the boxplot can represent multiple VUSs due to overlap in ∆∆GFold (also applies to panel b). b A box plot for all VUSs in the DVD. Outliers colored in red are prioritized VUSs that have a large ∆∆GFold (≥ 1.8 kcal/mol) and a high CADD score (> 25.7). Unprioritized VUSs do not have a high CADD score. The number of prioritized VUSs belonging to each box is printed in red below the total number of observations belonging to the box

