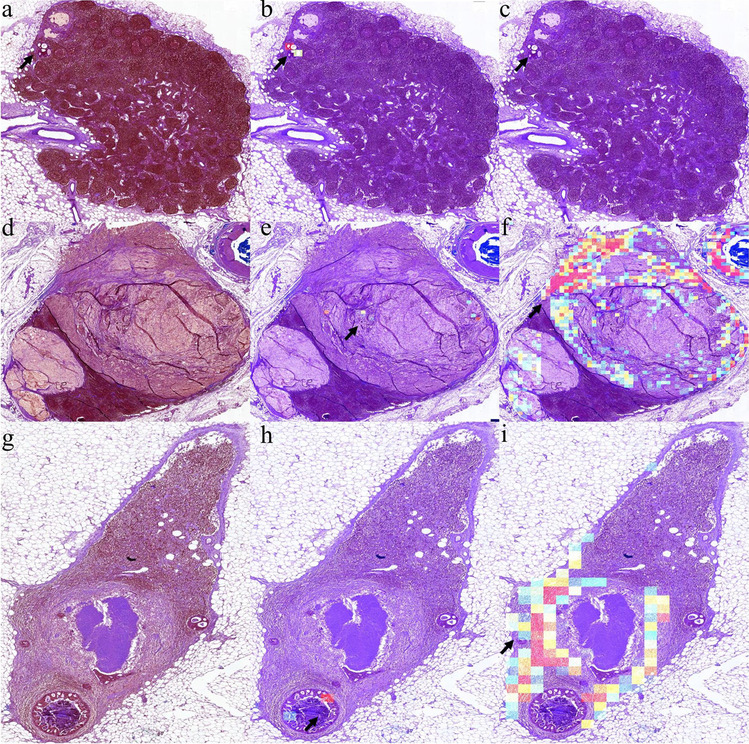
Fig. 9.

Examples of visualization images for lymph node classification task. In each row, the first figure is a color-processed lymph node image (a, d, and g), the second (b, e, and h), and the third (c, f, and i) is an attention map and a probability map corresponding to the lymph node image. a–c An example of ITCs shows that tumors with typical glandular structures could be identified. d–f An example of mucinous carcinoma with signet ring carcinoma shows that our model is poor at identifying tumors with scattered or solid structures in the attention maps. g–i An example of a post-treatment lymph node shows that fibers are more evident than tumors in the probability maps
