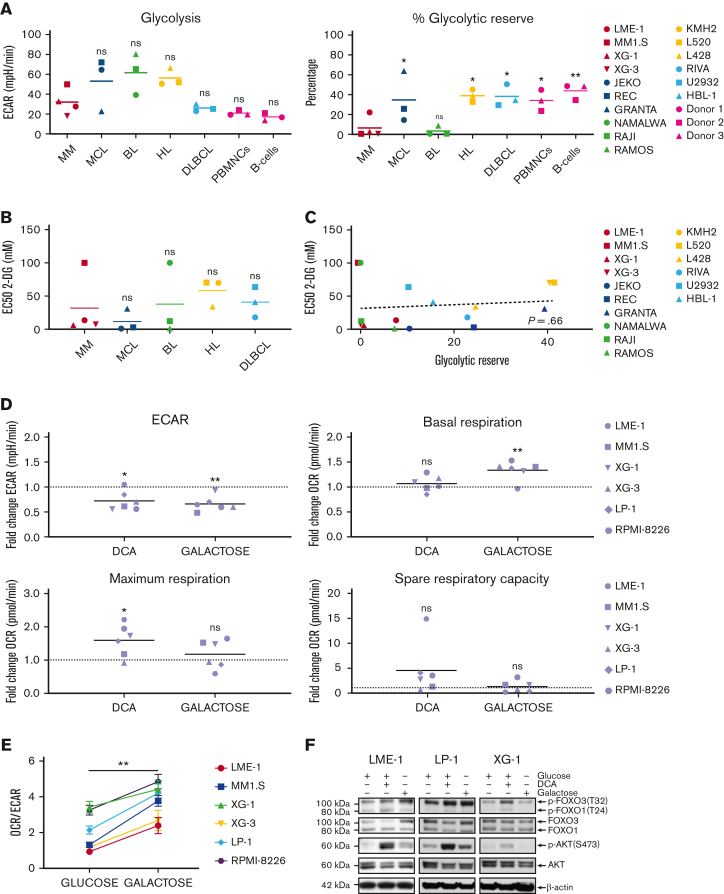
Figure 1.
MM cells show restricted glycolytic reserve and heterogeneous metabolic flexibility. (A) Seahorse XF real-time metabolic profiling of HMCLs (red symbols) and BCLs (blue, green, yellow, and light blue symbols), CpG-activated PBMNCs and purified human peripheral blood B cells (pink symbols). Mean values for basal glycolysis and normalized glycolytic reserve (percentage of basal glycolysis) based on ECAR and mean values for basal respiration and normalized spare respiratory capacity (percentage of basal respiration) based on OCR are depicted (one-way ANOVA with Bonferroni multiple comparisons test; HMCLs vs BCLs, n = 5 measurements. (PBMNCs and purified B cells were obtained from 3 healthy donors). (B) Half maximal effective concentrations (EC50) of 2-DG for cell death in HMCLs and BCLs after 3 days of treatment. Mean values of 3 individual experiments are depicted. (C) Linear regression analysis of the glycolytic reserve values (x-axis) vs the EC50 values for 2-DG (y-axis) in HMCLs and BCLs. (D) Fold change of ECAR, basal respiration, maximum respiration, and spare respiratory capacity (OCR) from a Seahorse XF mitochondrial stress test in HMCLs treated with DCA (25 mM for 20 hours) or cultured for 4 days in a galactose-containing medium (11.1 mM, no glucose). Means of 3 to 6 measurements are shown, and values are normalized to the untreated control condition and depicted as a dotted line (one-sample t test). (E) OCR/ECAR ratios of HMCLs cultured for 4 days in a glucose-containing medium or in a galactose-containing, glucose-free medium. Means ± SEM are shown (paired t test, n = 3-5 measurements). (F) Immunoblot analysis of total and phosphorylated (Ser473) AKT, total and phosphorylated (Thr24) FOXO1, and total and phosphorylated (Thr32) FOXO3 in the HMCLs LME-1, LP-1, and XG-1 cells cultured for 20 hours with or without 25 mM DCA or in a galactose-containing, glucose-free medium. β-actin served as a loading control. One-way ANOVA with Bonferroni multiple comparisons test ∗P < .05, ∗∗P < .01; One-sample t test ∗P < .05, ∗∗P < .01; paired t test, ∗∗P < .05; ANOVA, analysis of variance; ns, not significant; SEM, standard error of the mean.

