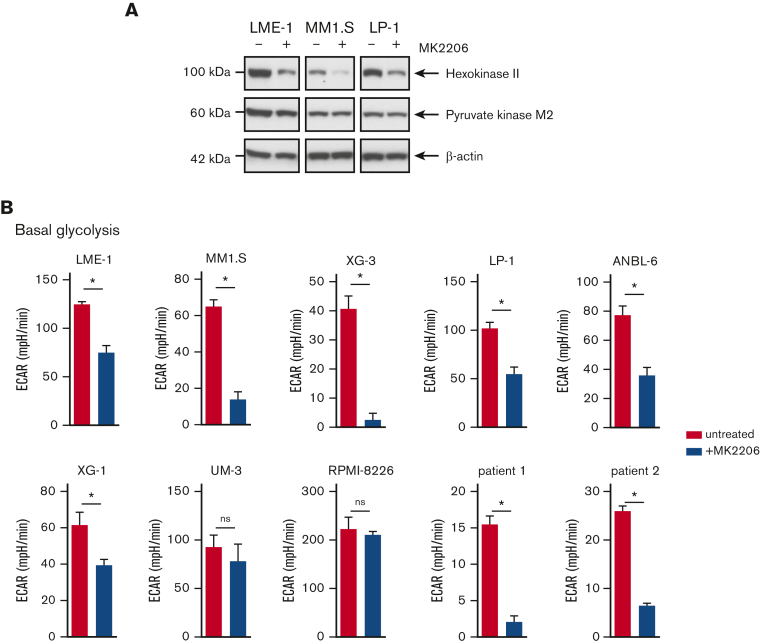
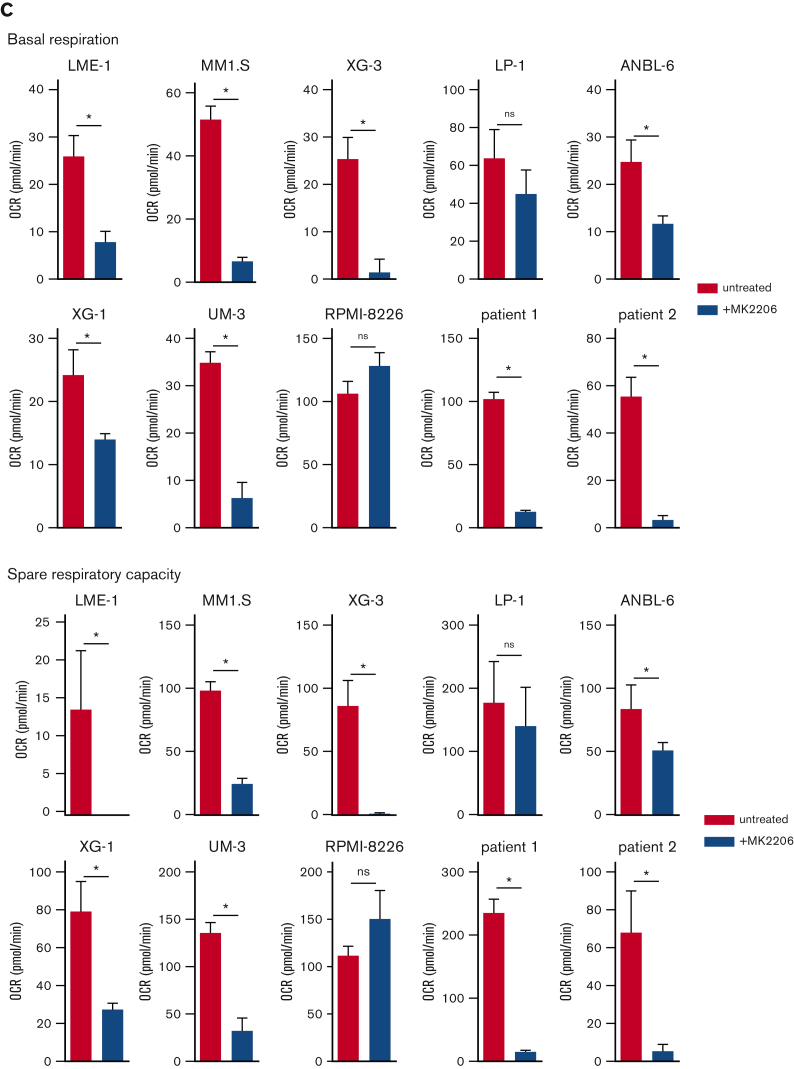
Figure 2.
AKT inhibition suppresses glycolysis and OXPHOS in MM cells. (A) Immunoblot analysis of HK2 and PKM2 in LME-1, MM1.S, and LP-1 HMCLs treated overnight with 2.5 μM MK2206 AKT inhibitor or left untreated. β-actin served as a loading control. (B) Basal glycolysis in HMCLs and MMPCs (n = 2 patients) treated with 2.5 μM MK2206 (blue bars) for 20 hours or untreated (red bars). Basal ECAR values from the Seahorse XF glycolysis stress test are depicted, and means ± SEM are shown (t test, n = 5-6 measurements). (C) Basal respiration and spare respiratory capacity in HMCLs and MMPCs (n = 2 patients) treated with 2.5 μM MK2206 (blue bars) or untreated (red bars) for 20 hours. OCR values from the Seahorse XF mitochondrial stress test are depicted, and means ± SEM are shown (t-test, n = 5-6 measurements).t test, ∗P < .05; MMPC, primary MM plasma cells.


