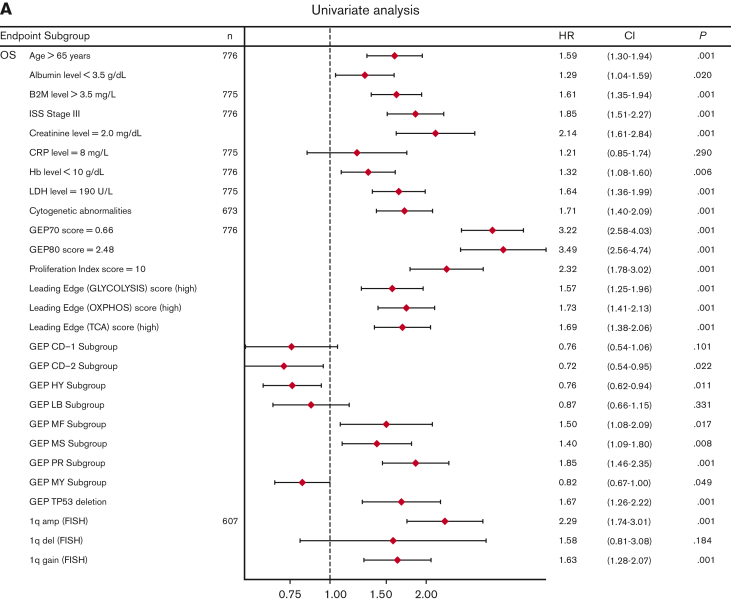
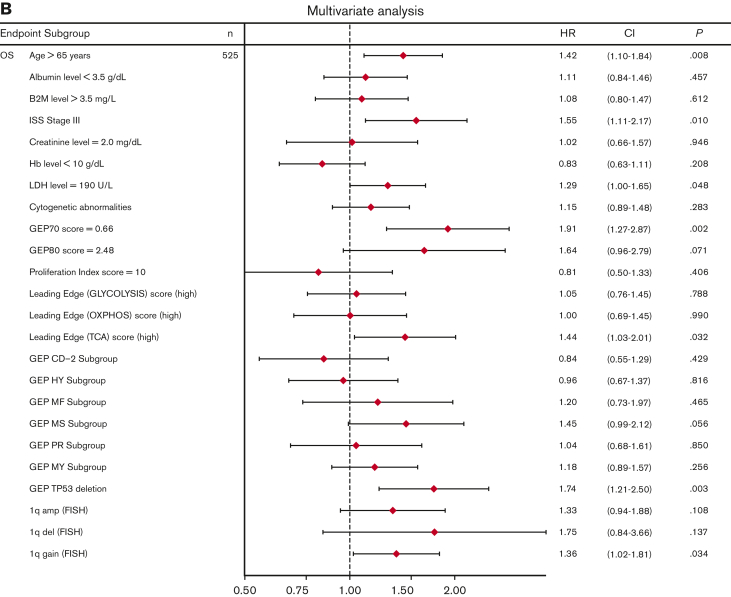
Figure 6.
Univariate and multivariate Cox regression analysis of OS in the TT2 and TT3 cohort of patients with MM. (A) Univariate analysis of subgroups (n = 776 patients; alternative numbers of patients indicated in case values/data were missing) for OS. P-values were determined with Wald χ2 test in Cox regression analysis. All univariate P values were reported regardless of significance. (B) Multivariate analysis of subgroups (n = 525) for OS. HR (diamond symbols) and 95% CI (lines) are indicated. CI, confidence interval; B2M, beta2-microglobulin; Hb, hemoglobin; HR, hazard ratio; ISS, International Staging System; LDH, lactate dehydrogenase.


