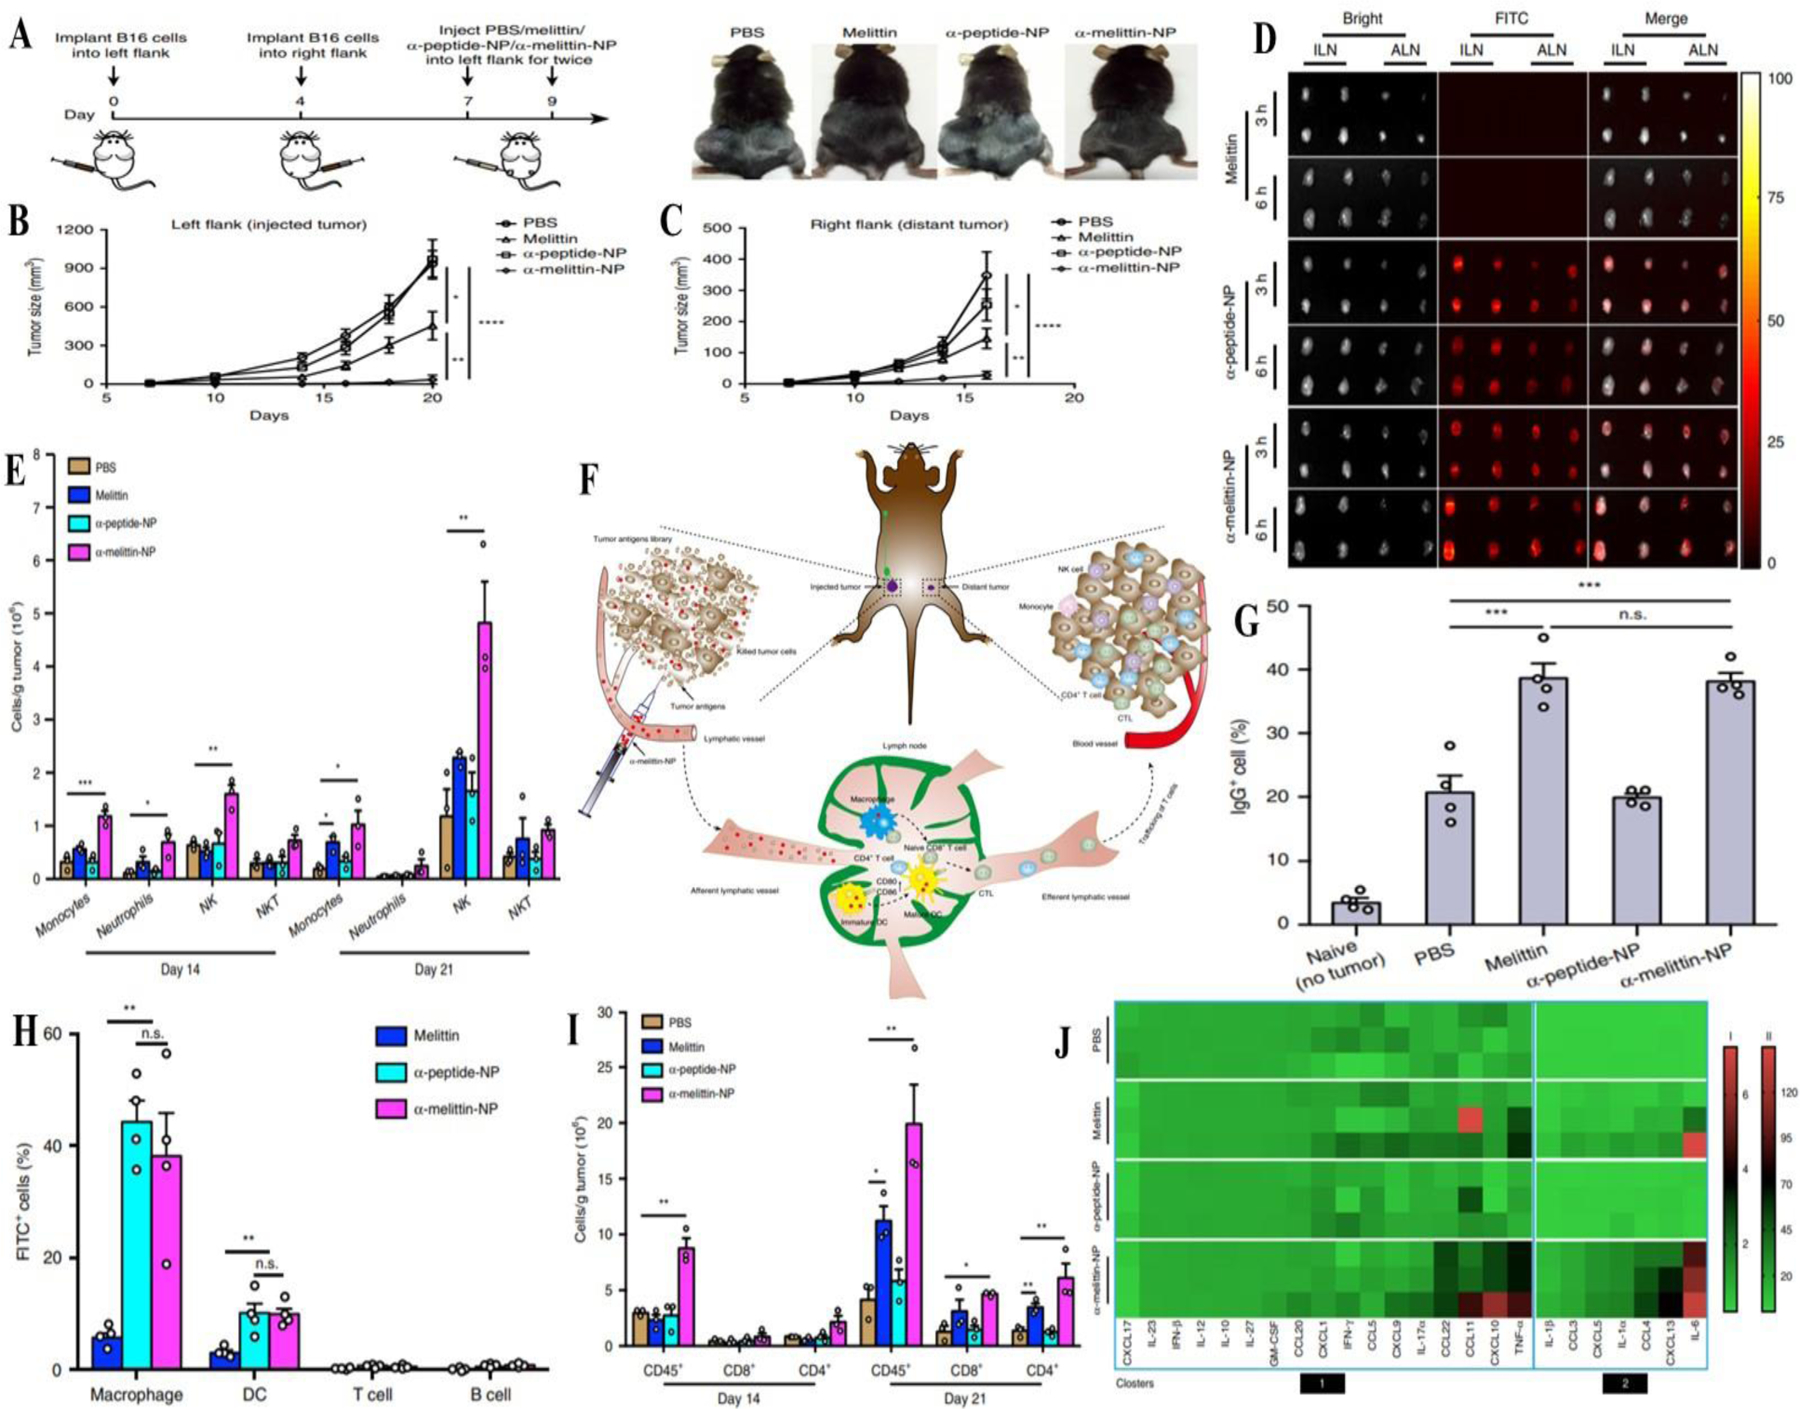
Figure 5.

A) Schematic representation of treatment of B16F10 melanoma tumors in mice inoculated in the left and right flanks (n=10 mice per group); B) Tumor size distribution in left flank for PBS, melittin, α-peptide and α-melittin nanoparticles; C) Tumor size distribution in right flank for PBS, melittin, α-peptide and α-melittin nanoparticles; D) Fluorescence images of excised lymph nodes of C57BL/6 mice post subcutaneous injection; E) Immune cell count at the 14th and 21st day following immunization; F) Schematic representation of vaccine effect in situ; G) IgG antibody count in different treatment groups; H) Flow cytometry assisted immune cell count; I) Cluster of differentiation cell count at 14th and 21st day following immunization; J) Cytokine/chemokine levels in the TME. Reprinted from Yu et al. (Yu et al., 2020) licensed under CC BY 4.0 (https://creativecommons.org/licenses/by/4.0/legalcode). Copyright © 2020.
