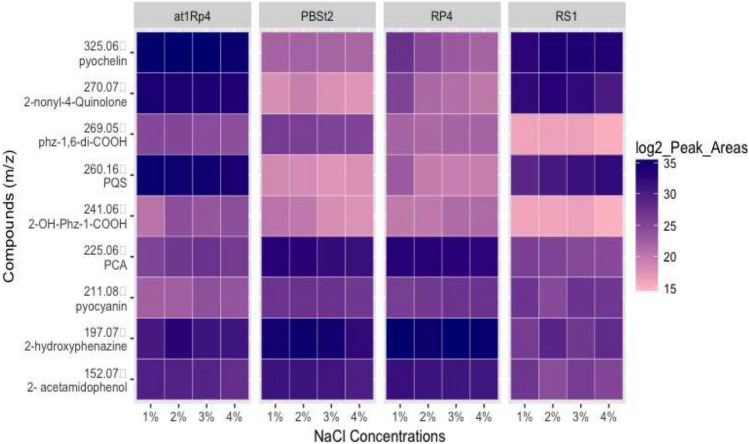
Fig. 1.
Heat map for the LC–MS/MS profiles of selected specialized metabolites produced by Pseudomonas spp. strains PB-St2, RP-4, At1RP4, and RS1, treated with increasing concentrations of NaCl grown on DMB medium for 96 h. Blue color indicates increased metabolite production with respect to salinity concentration, whereas pink color indicates decreased production. Metabolites production remained relatively consistent for all the strains regardless of NaCl concentration

