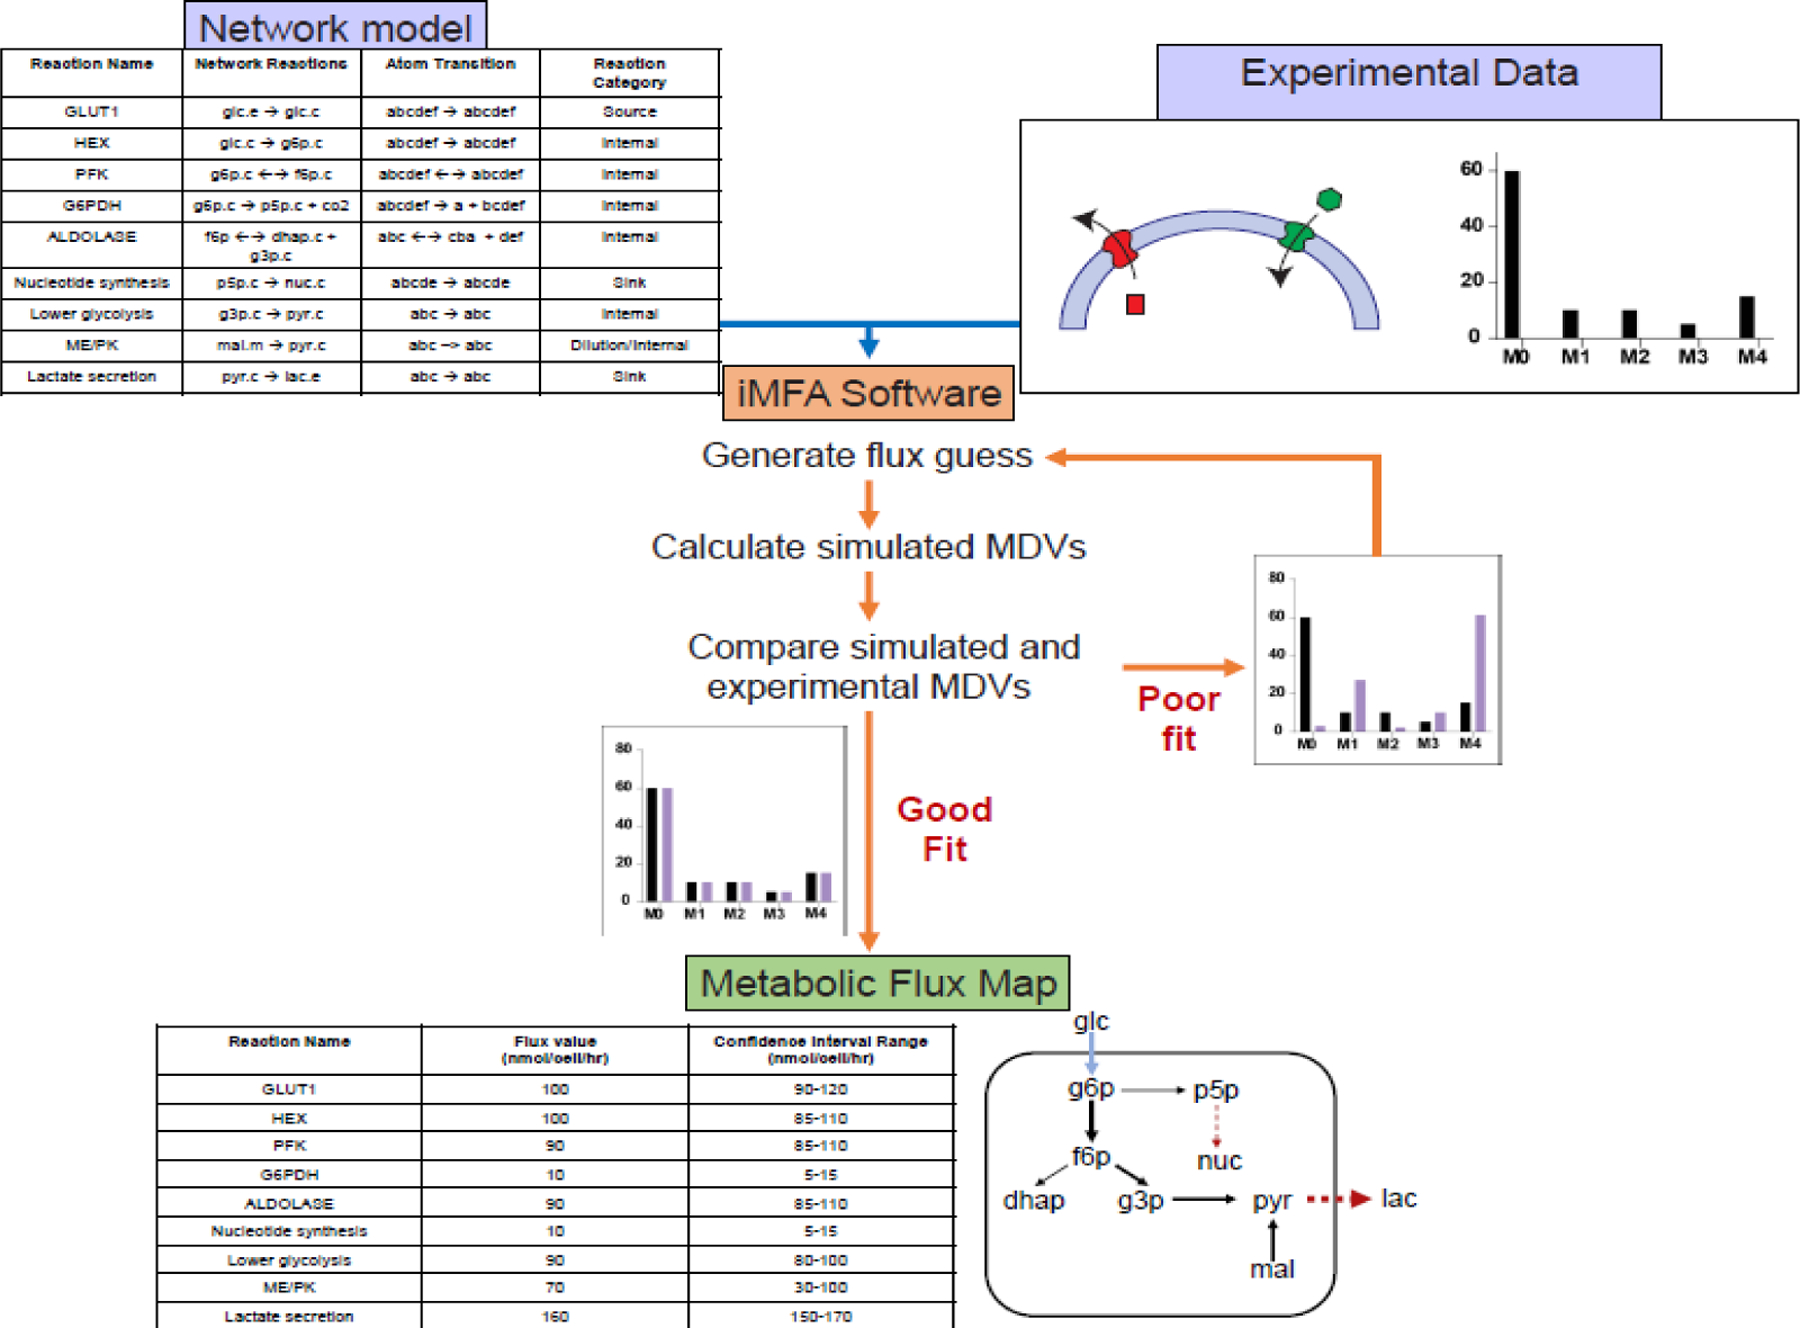
Figure 1. iMFA workflow.

Experimental data, including MDVs and extracellular fluxes, and a metabolic network model are input into the iMFA software. Each reaction in the network model contains detailed information on the compartments of source and product metabolites, as well as the specific carbon atom transitions that occur in the reaction. In some software, such as INCA and eiFlux, compartments can be designated by adding a suffix after the metabolite name (e.g., cytoplasmic as “.c”, extracellular as “.e”, and mitochondrial as “.m”). The iMFA software then iteratively finds a set of fluxes that minimize the error between the simulated and experimental MDVs. When a good fit is achieved, the iMFA software outputs flux values and associated confidence intervals for each reaction flux. This information can be visualized as a flux map, in which arrow thickness represents the relative flux magnitude. The flux map shown here also indicates source reactions (light blue), sink reactions (dark red, dashed), and internal reactions (black).
