Figure 2.
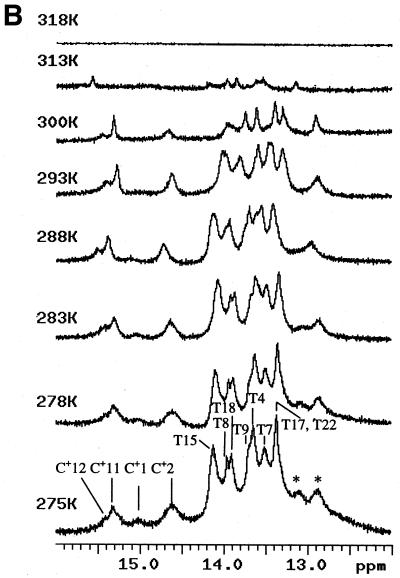
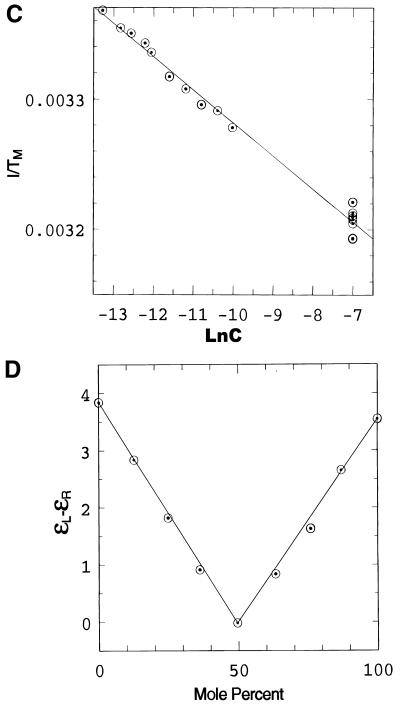
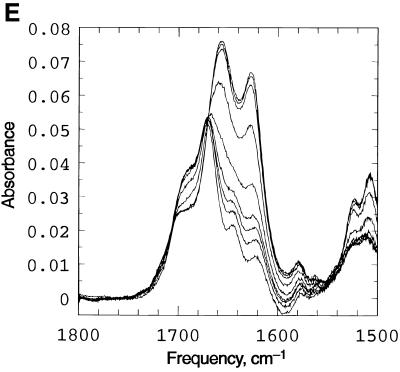
Spectroscopic studies showing the effect of temperature, pH and concentration on the the complex formed when d(CCATAATTTACC) (C1) and d(CCTATTAAATTC) (C2) are mixed in 1:1 stoichiometry. (A) UV temperature profiles as a function of pH. The numerals identify the pH values as follows: 1, pH 5.04; 2, pH 5.57: 3, pH 5.85; 4, pH 6.19; 5, pH 6.18; 6, pH 7.0; 7, pH 7.4. (Inset) Melting temperature of the duplex as a function of pH. (B) Temperature dependence of the imino (3NH) proton region in the 1D 1H NMR spectrum of the same system recorded in a mixed solvent of 90% H2O and 10% 2H2O at pH 5.5. The numbering of the cytosine and thymine nucleotides is as given in Scheme 1. The assignments of C+/T(3NH) protons are as described in the text. (C) Dependence of 1/Tm on the natural logarithm of the concentration (C) of the oligomers at pH 5. The concentration is here expressed as mol phosphate. Points at lnC < –10 are experimental data from the UV melting curve, while points at lnC = –7 correspond to experimental data from the IR melting curve (D) CD mixing curve as a function of C2 mol fraction (0.01 M Na cacodylate pH 5, 1.0 M NaCl, 8°C). Identical curves were obtained using UV. (E) IR spectra of C1:C2 in D2O as a function of temperature (0.2 M Na cacodylate pH 5.0, 1.0 M NaCl, 0.02 M total oligomer concentration). The lowest absorbance curve corresponds to the fully helical complex at 20.1°C and the temperature steps reflected by increasing absorbance are 27.5, 32.0, 34.3, 37.2, 40.0, 42.8, 46.1 and, at the maximum absorbance, 50.9°C.


