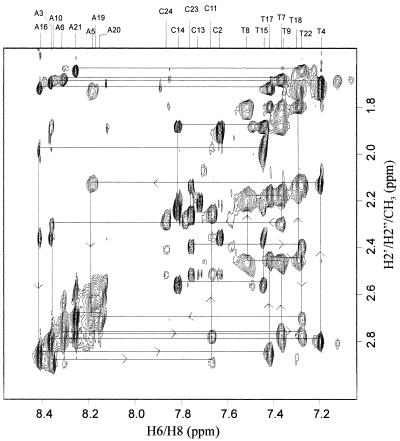
Figure 3.
Selected region of the pure absorption NOESY spectrum of the non-exchangeable protons in the duplex formed between d(CCATAATTTACC) and d(CCTATTAAATCC), recorded in 99.9% 2H2O at pH 5.5. This sub-spectrum shows self and sequential NOE cross-peaks between the sugar H2′, H2″ and CH3 protons and the base H2/H6/H8 protons. The assignment of various peaks was completed following the standard procedure and the walk steps are indicated in the figure. Experimental parameters were as follows: τm = 200 ms, recycle delay 1 s, 64 scans/t1 increment, time domain data points of 600 and 4096 in the t1 and t2 dimensions, respectively. The 1H carrier frequency was kept at the water resonance. The data were multiplied by sine bell window functions shifted by π/4 and π/8 along the t1 and t2 axes, respectively, and zero filled to 1024 data points in the t1 dimension prior to 2D-FT. The digital resolution along the ω1 and ω2 axes correspond to 5.8 and 1.5 Hz/point, respectively.

