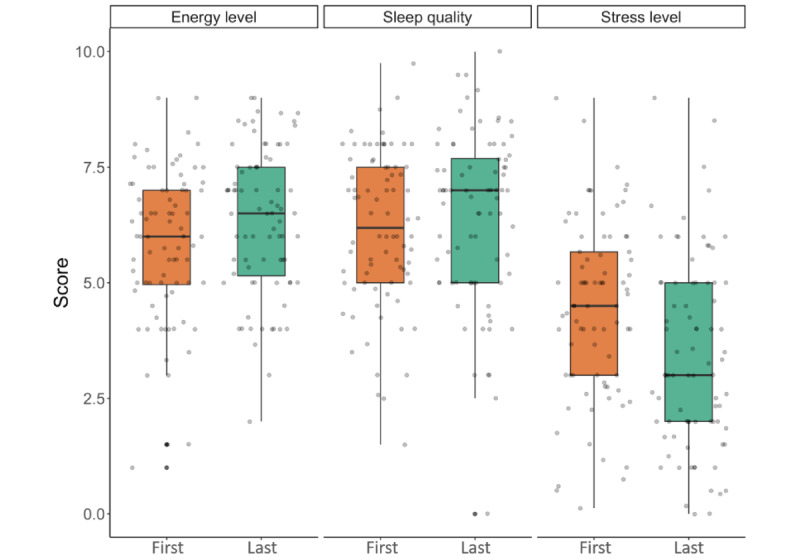
Figure 3.

Ratings for energy levels, quality of sleep, and stress levels of completers from first to last observation in the completers group. Energy levels, quality of sleep, and stress levels were scored by participants on a scale of 0 to 10 at the first and last observations. The box plot represents the IQR with Tukey-style whiskers; the horizontal line in the box plot represents the median. Each dot represents the score of a single individual.
