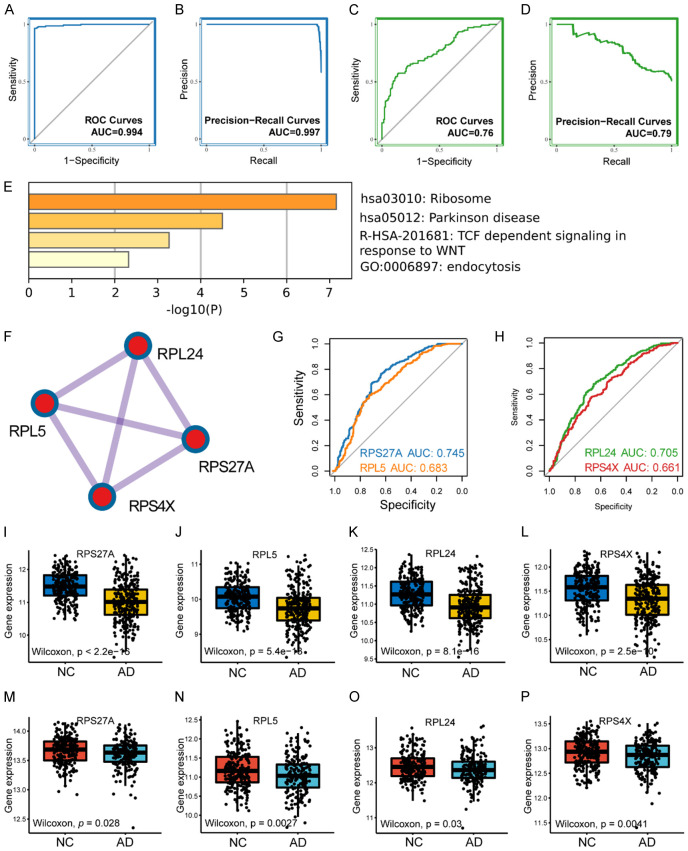
Figure 3.
Gene model validation and hub biomarkers identification. Receiver operator characteristic curve of gene model in training cohort (A) and testing cohort (C). Precision-recall curve of gene model in training cohort (B) and testing cohort (D). (E) The bar plot has displayed the results of functional enrichment analysis of the gene model. (F) Hub biomarkers identified by molecular complex detection algorithm. (G) ROC analysis of RPS27A and RPL5 in testing cohort. (H) ROC analysis of RPL24 and RPS4X in testing cohort. The gene expression profile of RPS27A (I), RPL5 (J), RPL24 (K) and RPS4X (L) in training cohort. The boxplots have demonstrated the expression of RPS27A (M), RPL5 (N), RPL24 (O) and RPS4X (P) in testing cohort. Abbreviation: ROC: receiver operator characteristic; AUC: area under curve; AD: Alzheimer’s disease; NC: normal control.

