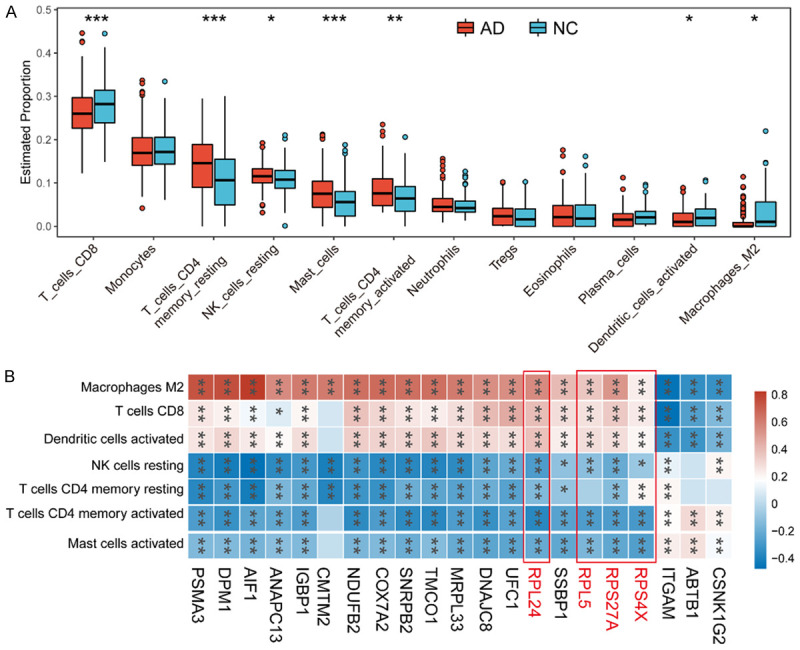
Figure 4.

Immune cell infiltration in training cohort. A. The boxplot has shown the proportions of different types of immune cells in AD and normal control samples. B. Correlation heatmap has displayed the association between the expression of hub biomarkers and immune cell infiltration. Abbreviation: AD: Alzheimer’s disease; NC: normal control.
