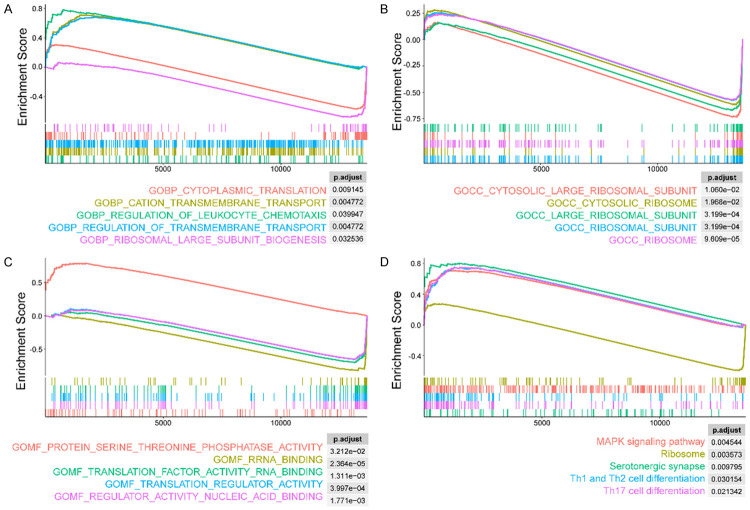
Figure 7.
The GSEA plots have shown the biological function and pathway enrichment of DEGs in CD4+ T cells in the peripheral blood of AD patients and normal control. By using gene ontology gene sets, we conducted enrichment analysis of BP (A), CC (B) and MF (C) for DEGs and only the top 5 terms were displayed. For explore the molecular pathway enrichment for DEGs, the KEGG analysis was introduced, and the top 5 enriched pathway were demonstrated (D). Abbreviation: BP: biological process; CC: cellular component; MF: molecular function; DEGs: differentially expressed genes.

