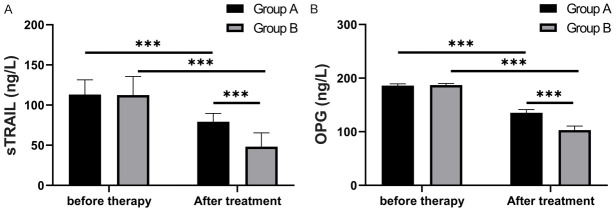
Figure 6.
Levels of sTRAIL and OPG. The levels of serum sTRAIL (A) and OPG (B) decreased in both groups after treatment (P<0.001), and there was no difference between them before treatment (P>0.05), but the levels in group B were lower than those in group A after treatment (P<0.001). Note: *** means P<0.001, Soluble tumor necrosis factor related apoptosis inducing ligand (sTRAIL), Osteoprotectin (OPG).

