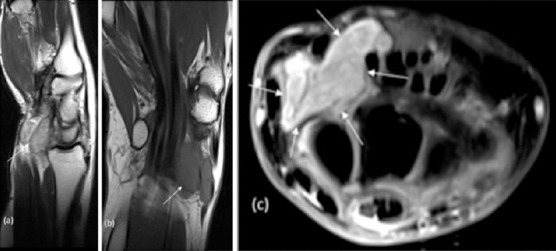
Figure 7.

Right wrist at initial presentation: Sagittal T2 (a), Coronal T1 (b) Axial PD fat sat (c) Prominent soft-tissue mass on the volar surface of the wrist at the radio scaphoid articulation, which is T1 low, T2 isointense and bright on PD fat sat (white arrows).
