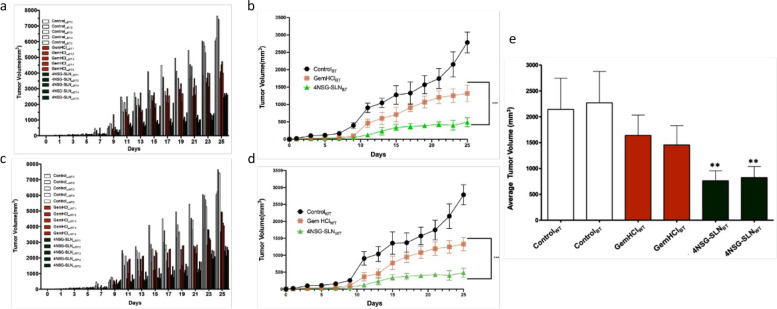
Fig. 8.
Tumor volume growth for individual PDX mice in each treatment group. a Normalized tumor volume of GemHCl and 4NSG-SLN from Black (BT) PCa patients (n = 5), (b) Tumor growth curves of GemHCl and 4NSG-SLN treated mice bearing PCa PDX tumor from Black patients, (c) Normalized tumor volume of GemHCl and 4NSG-SLN from White (WT) PCa patients (n = 5), (b) Tumor growth curves of GemHCl and 4NSG-SLN treated mice bearing PCa PDX tumor from White patients, (d) mean terminal tumor growth volumes of control, GemHCl, and 4NSG-SLN treatment groups of PDX mice bearing tumors from Black and White PCa patients. Data represented as means ± SD, n = 5. The significance difference (GemHCl vs 4NSG-SLN, **p < 0.001) was determined by one-way ANOVA

