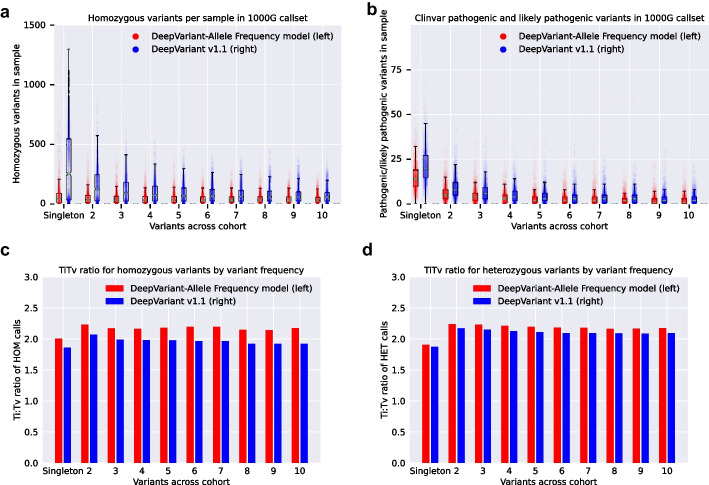
Fig. 5.
Cohort-level rare variant metrics in the 1000genomes using DeepVariant-AF and DeepVariant v1.1. Calls in each plot are stratified by the frequency of calls in a sample, ranging from a call present in only one sample (singleton) to a call in 10 different samples. a The number of homozygous variant calls per sample (each dot is one 1000 g sample). b The number of Clinvar pathogenic or likely pathogenic variants per sample (each dot is one 1000 g sample). c The Ti:Tv ratio for calls by frequency for homozygous variant calls, averaged across all samples. d The Ti:Tv ratio for calls by frequency for heterozygous variant calls, averaged across all samples

