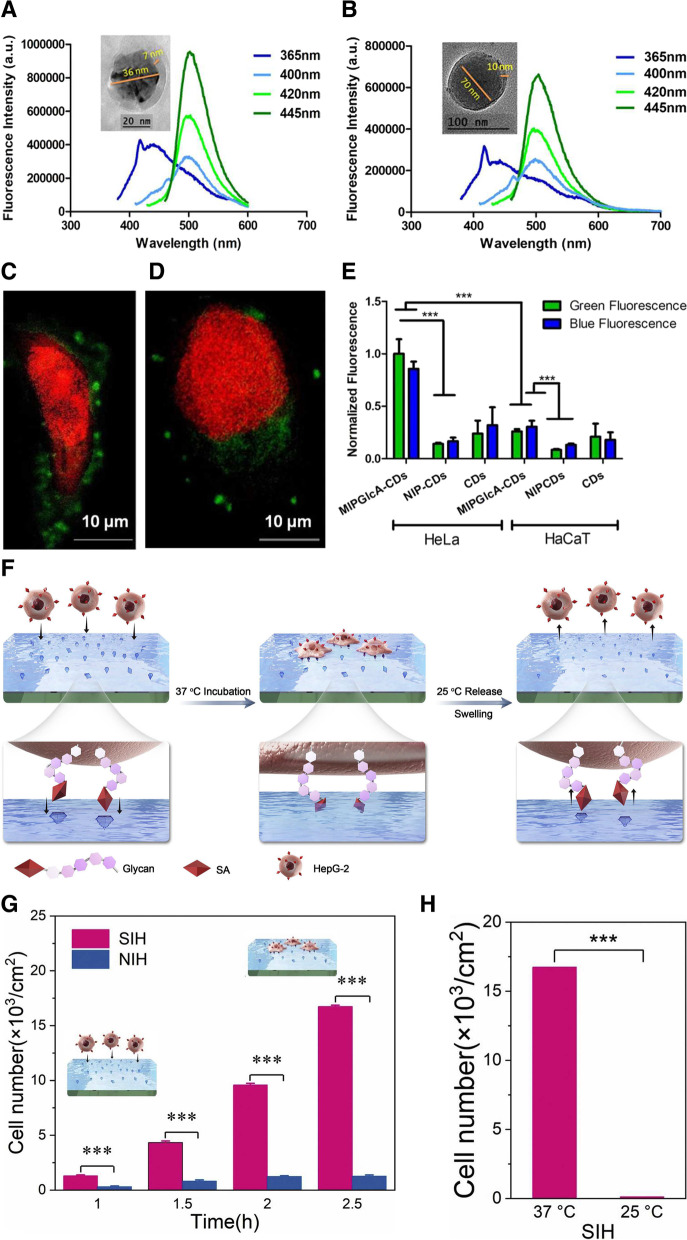
Fig. 8.
A CD-MIPGlcA and (B) CD-NIP with different excitation wavelengths in the range of 365–445 nm, slit 2.5 nm. The small peak around 420 nm at excitation 365 nm is due to the water Raman peak. Insets are corresponding transmission electron microscopy (TEM) images. Confocal micrographs showing labeling of GlcA on a single (C) HeLa and (D) HaCaT cell by CD-MIPGlcA (green) and nuclear staining with propidium iodide (red). E Analysis of labeled cells with CD-MIPGlcA, CD-NIP, and CD as obtained from ImageJ by measuring the normalized fluorescence of each single cell area from five different images. F Thermo-responsive SA-imprinted hydrogel layer enables selective capture and release of cancer cells. G The numbers of captured HepG-2 at different time intervals. H Comparison of capture and release efficiency of cancer cells. A, B, C, D, E Reproduced with permission from [114], published by The American Chemical Society 2018. F, G, H Reproduced with permission from [58], published by Elsevier 2021

