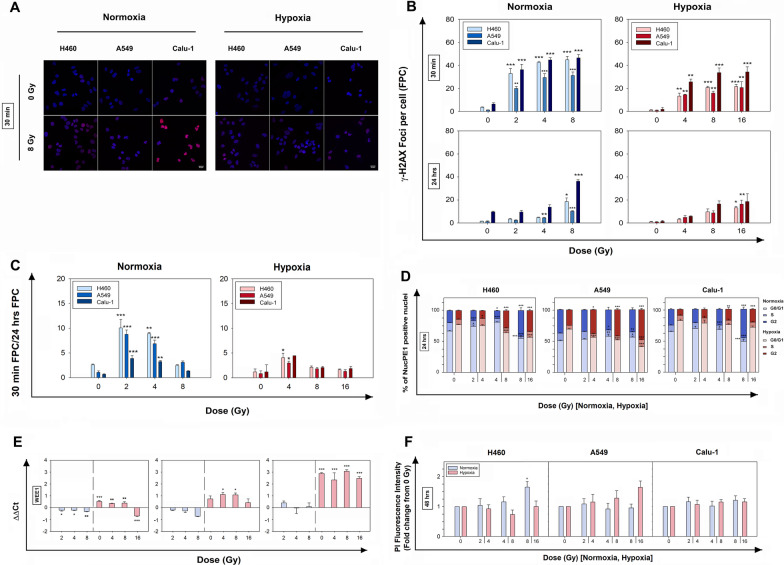
Fig. 2.
Effects of X-rays on DNA damage, gene expression, cell cycle and viability in H460, Calu-1 and A549 cells. A Representative confocal immunofluorescent images of γ–H2AX foci at 0 Gy and 8 Gy, 30 min after IR. B Detection of γ–H2AX foci in normoxia and hypoxia at 30 min and 24 h post-IR at different doses, including the respective non-irradiated controls (0 Gy). C Repair capacity determined by the ratio of foci count per cell (FPC) at 30 min and 24 h in normoxia and hypoxia. The data in A and C represent mean FPC ± SEM (n = 3); samples were analyzed at a confocal microscope with a sample size of > 100 cells per replicate and compared to their respective 0 Gy group (one-way ANOVA). D Stacked bar chart showing the cell cycle distribution (in %) of normoxic and hypoxic NucPE1-positive nuclei after 24 h from X-ray exposure. E Relative mRNA expression levels of WEE1 in normoxic and hypoxic samples 24 h post-IR. The data are presented as mean of the ΔΔCt values ± SEM (n = 2, each in triplicate). All samples were compared to the 0 Gy normoxic sample represented as the 0 on the x-axis (one-way ANOVA). F Flow cytometric quantification of dead cells 48 h post-IR by staining with propidium iodide (PI). The data in D and E represent the mean ± SEM (n = 3) and were statistically compared to their respective 0 Gy group (one-way ANOVA). *p < 0.05, **p < 0.01, ***p < 0.001

