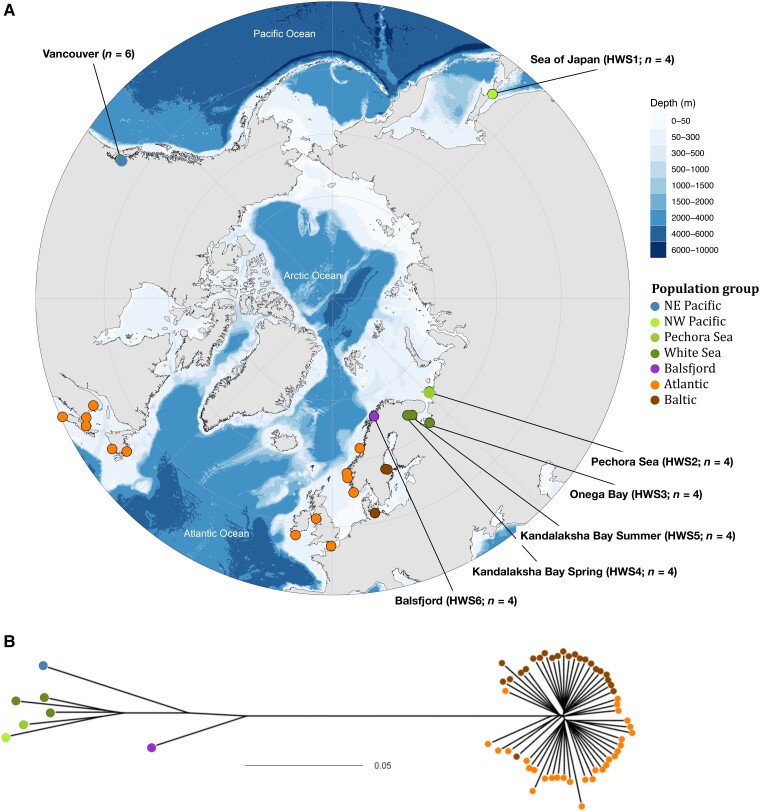
Fig. 1.
Sample locations and genetic distances among Pacific and Atlantic herring populations from different oceans and sea areas. A) Location of samples of Pacific herring from Balsfjord, European Russia (Pechora and White Seas), and from the NW Pacific (Sea of Japan) and NE Pacific (Vancouver) (supplementary table S1, Supplementary Material online). For detailed information on locations of Atlantic and Baltic herring samples, see Han et al. (2020). n denotes the number of individual samples for the respective location The base map was created using ggOceanMaps (https://mikkovihtakari.github.io/ggOceanMaps/), using data from the National Centers for Environmental Information (https://www.ngdc.noaa.gov/mgg/global/relief/ETOPO1/docs/ETOPO1.pdf). B) Neighbor-joining tree based on allele frequency distances from 105 randomly selected SNPs in poolseq data from 60 populations of Pacific and Atlantic herring. The scale represents the average difference in allele frequency per SNP. Populations are colored as in a.

